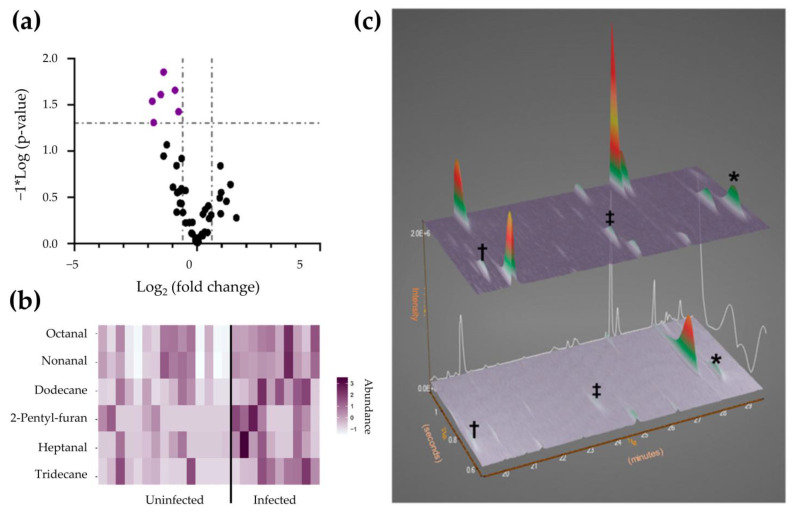
Figure 4.
Biomarker compounds of pediatric SARS-CoV-2 infection. (a) Volcano plot of breath metabolites. (b) Heatmap visualizing the abundance of biomarkers. (c) GC×GC–TOFMS surface plots of representative pediatric breath samples (top, SARS-CoV-2 infected; bottom, SARS-CoV-2 uninfected; †, heptanal; ‡, octanal; *, nonanal). Adapted with permission from Ref. [150]. Copyright © 2023 by the authors; American Chemical Society, Washington, DC, United States.

