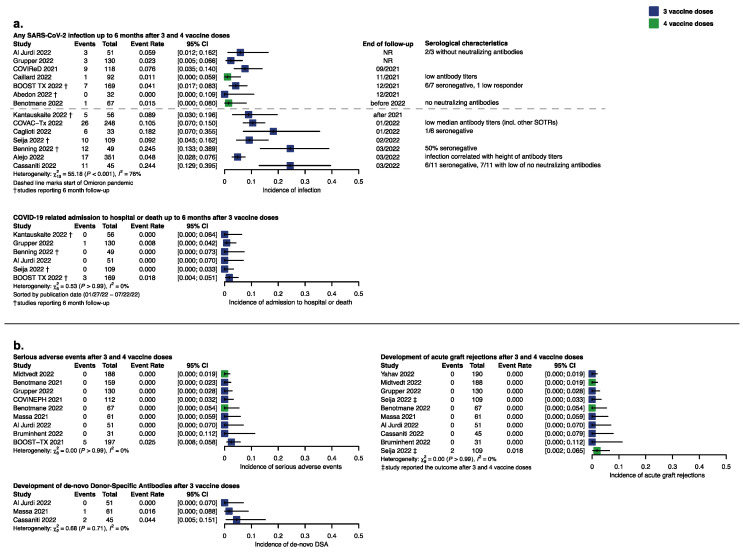
Figure 3.
Response and event rate for prioritized efficacy and safety outcomes depicted as forest plots. (a) Incidence of SARS-CoV-2 breakthrough infection according to observation period with serological characteristics of infected KTRs and incidence of COVID-19-related hospital admission or death. (b) General and transplant-specific safety outcomes after 3 and 4 vaccine doses [20,21,23,26,30,32,33,34,37,41,42,43,48,49,53,55,56,57].

