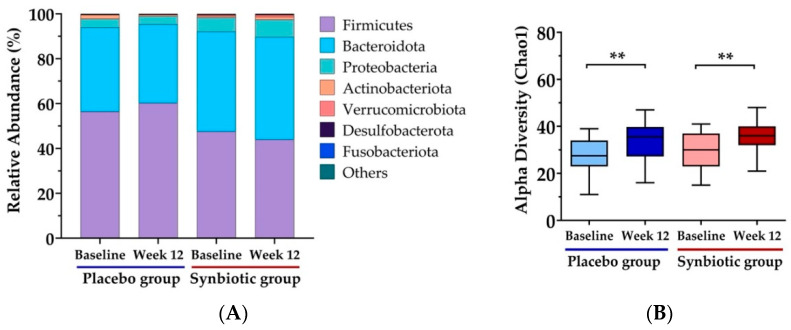
Figure 2.
Effect of 12-week synbiotic intervention on gut microbiota composition in overweight and obese subjects. (A) Bar graphs show the phylum-level inter-individual variability in fecal microbiota. (B) The box plot shows the interquartile range, maximum value, and minimum value for the alpha diversity index: Chao1, which measures community richness. Values are represented as mean ± SD. ** p < 0.01 compared to baseline.

