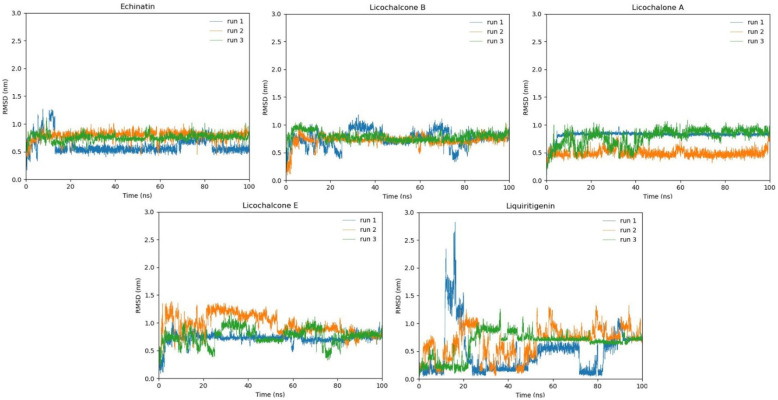
Figure 10.
The graph exhibits the root mean square values of five selected compounds throughout a 100 ns MD simulation period. Three runs are indicated by different colors: run1 is indicated in blue color, run2 is exhibited in orange color, and run3 is determined by light green color. All three runs manifest RMSD values for 100 ns carried individually.

