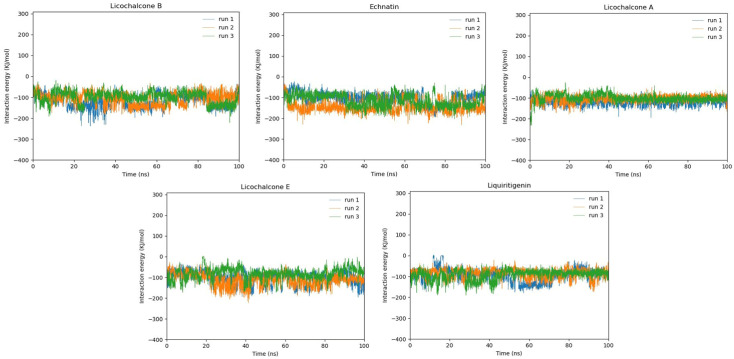
Figure 12.
Bar graph depicting the stability of total interaction energy for licochalcone B, echinatin, licochalcone A, licochalcone E, and liquiritigenin for all three runs of 100 ns. Every run is indicated by a different color (run1—blue, run2—orange, run3—light green). The triplicates of every compound were predicted separately.

