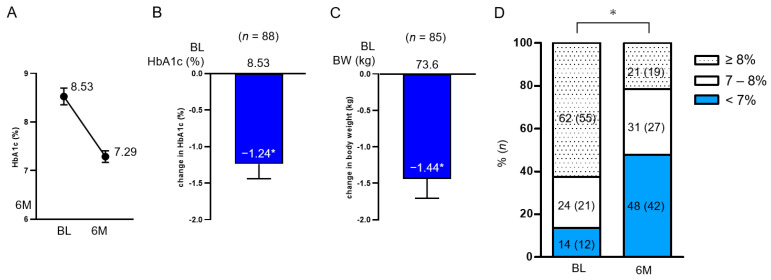
Figure 2.
Change in HbA1c (A,B) and BW (C) from baseline overall at 6 months and the proportion of patients achieving HbA1c < 7% (D). Data in the figure are shown as mean with SEM. * p < 0.001 in the Wilcoxon signed-rank sum test (B,C) and McNemar’s test (D) (vs. BL). BL, baseline; HbA1c, glycated hemoglobin; BW, body weight; SEM, standard error of the mean.

