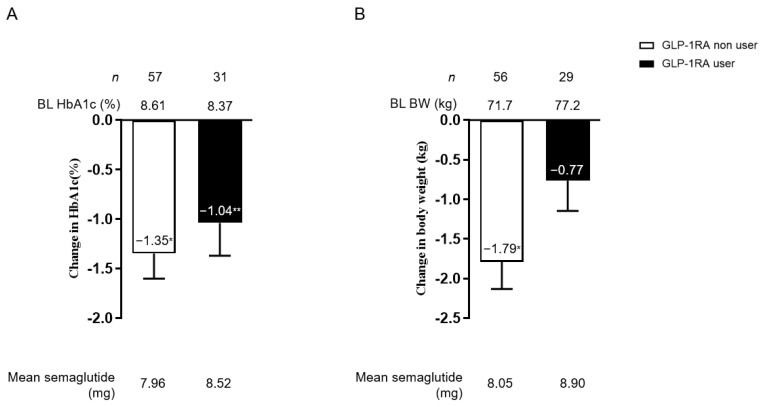
Figure 4.
Change in HbA1c (A) and BW (B) from baseline among prior GLP-1RA non-users and users. White bars indicate GLP-1RA non-users and black bars indicate GLP-1RA users. The mean oral semaglutide dosage is shown at the bottom of the figure. Data in the figure are presented as mean with SEM. * p < 0.001; ** p < 0.01 in the Wilcoxon signed-rank sum test (vs. BL HbA1c). BL, baseline; HbA1c, glycated hemoglobin; BMI, body mass index; GLP-1RA, glucagon-like peptide-1 receptor agonist; SEM, standard error of the mean.

