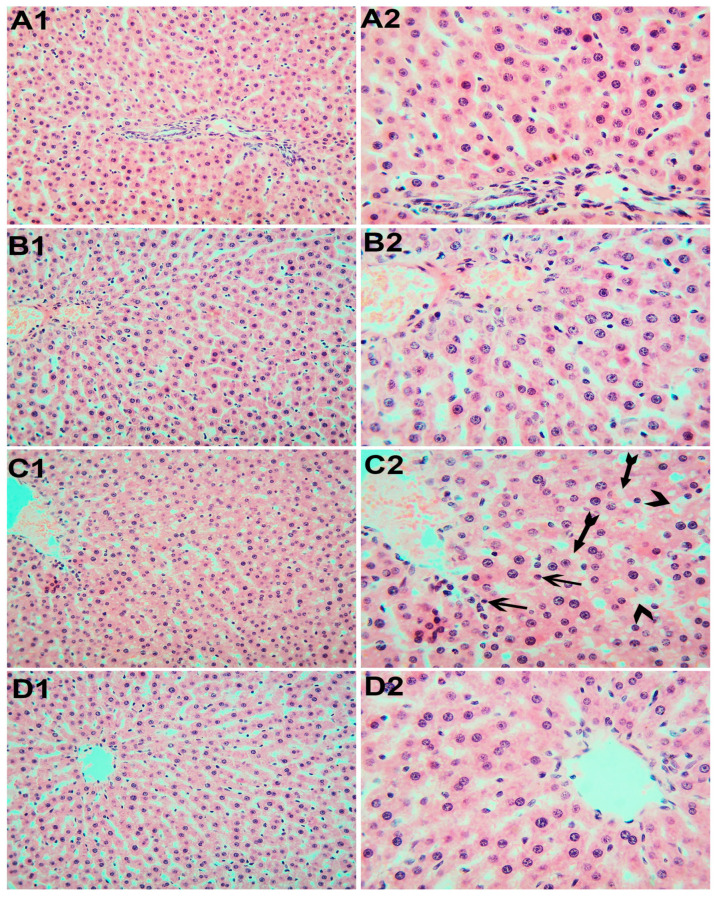
Figure 2.
Representative liver sections photomicrographs. (A1,A2) Liver of the control rats. (B1,B2) Rats that received Mg. (C1,C2) Rats exposed to SiNPs showing sinusoidal dilatation (arrowheads). The hepatocytes’ nuclei are of variable size with pyknosis of some nuclei (arrows). Most of the hepatocytes show cytoplasmic vacuolation (tailed arrows). (D1,D2) Rats exposed to SiNPs and received Mg, showing no obvious changes in the hepatocytes and hepatic sinusoids. H&E. (A1,B1,C1,D1) ×20 magnification. (A2,B2,C2,D2) ×40 magnification.

