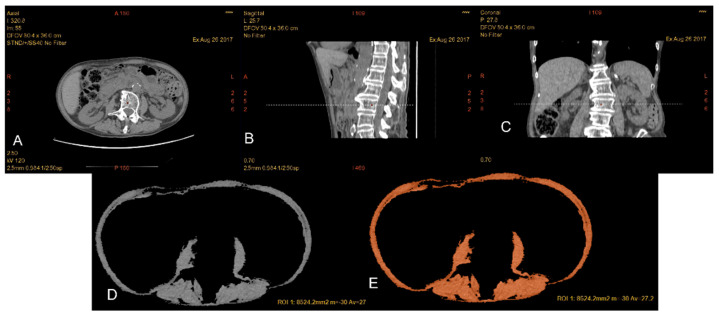
Figure 1.
Patient with reduced muscle mass (A–E): in (A), axial CT image at the level of L3 as confirmed by the corresponding reference line in the sagittal (B) and coronal (C) planes. By applying the threshold −29/+ 150 HU, it is possible to selectively choose the muscle component and draw a ROI including all the musculature at the level of L3 (TLA). Automatically, it is possible to read the overall value of the traced area in cm2 and the average value of the density.

