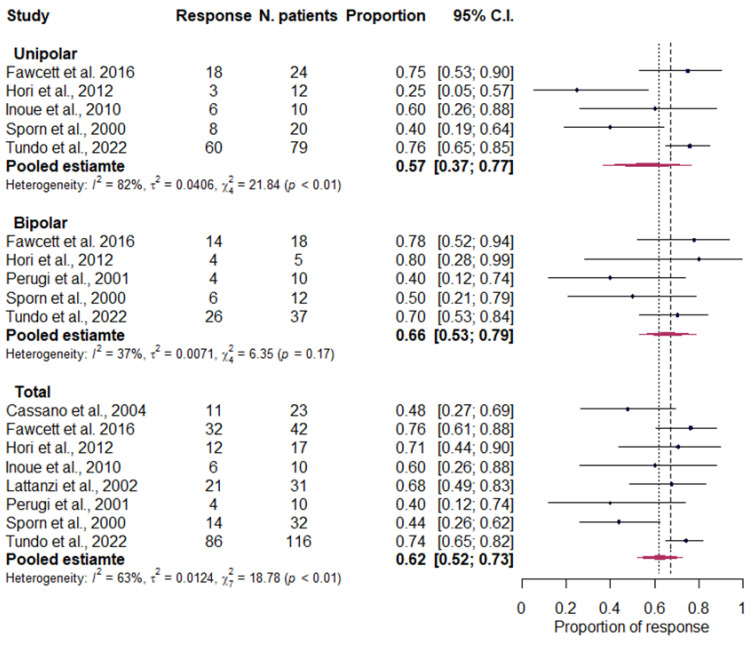
Figure 2.
Forest plot with the total pooled estimates of treatment response and by diagnosis. Cassano et al., 2004 [80]; Fawcett et al., 2016 [85]; Hori et al., 2012 [49]; Inoue et al., 2010 [81]; Lattanzi et al., 2002 [82]; Perugi et al., 2001 [83]; Sporn et al., 2000 [84]; Tundo et al., 2022 [86].

