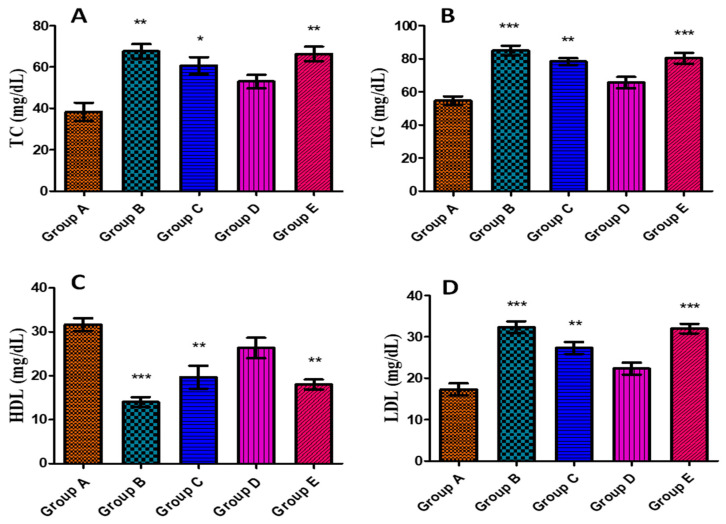
Figure 9.
Effect of J. regia-mediated AgNPs on serum lipid profile against aflatoxin-induced toxicity in albino rats: (A) TC, (B) TG, (C) HDL, and (D) LDL. Group A represents control group, group B represents aflatoxicated group, group C represents toxin + 20 µg AgNPs, group D represents toxin + 50 µg AgNPs, and group E represents toxin + 70 µg AgNPs. Data are mean ± SEM where p < 0.05. * represents the levels of significance between control/group A vs. other groups.

