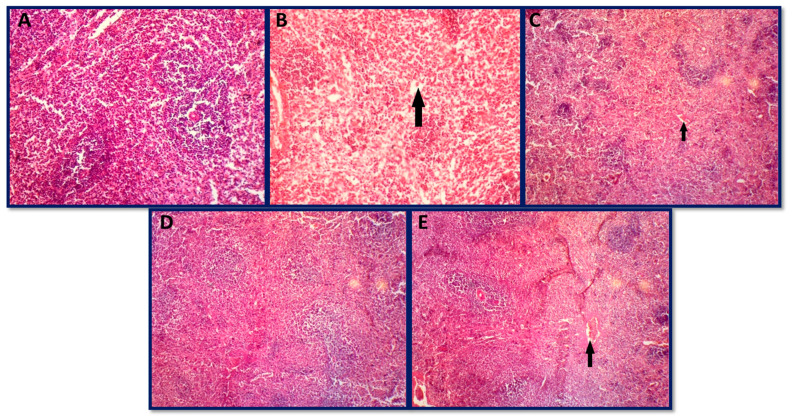
Figure 12.
Histopathological photomicrographs of the spleen: (A) group A (control group), (B) group B (aflatoxicated group) showed necrosis with slightly vacuolated cells, (C) group C (toxin +20 µg AgNPs) showed necrosis, (D) group D (toxin + 50 µg AgNPs) normal, and (E) group E (toxin + 70 µg AgNPs) showed mild necrosis (hematoxylin and eosin 10×).

