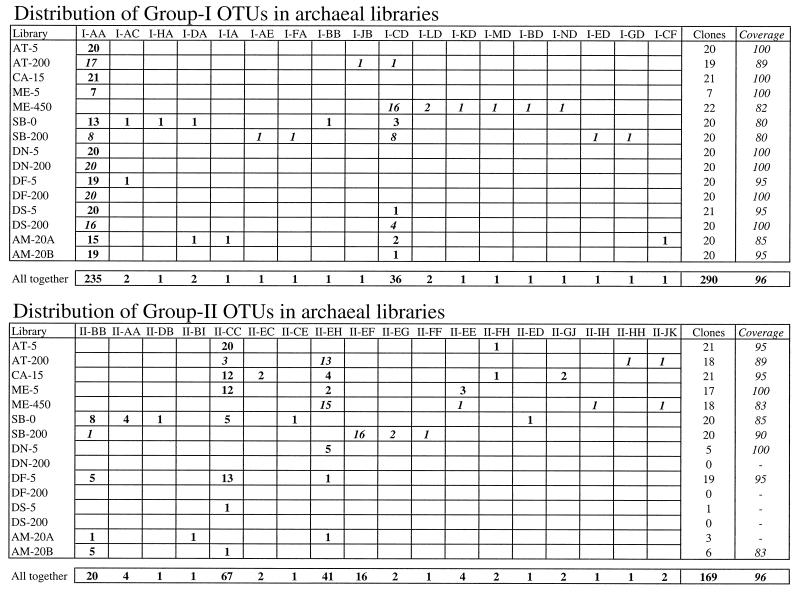
FIG. 1.
Distribution of group I and group II OTUs among the libraries analyzed. The figure shows the number of clones belonging to each OTU (in italics for deep libraries), the number of clones analyzed, and the coverage values for each library. The last row calculates the same parameters but considers all the clones in each group as belonging to the same assemblage.

