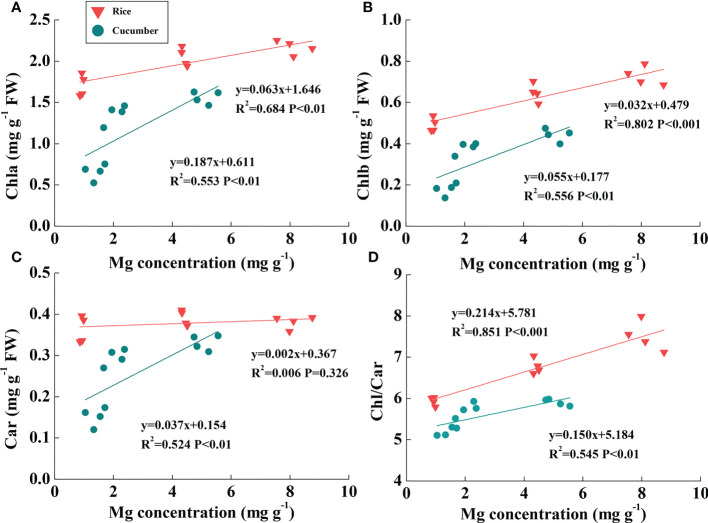
Figure 4.
The correlations of Mg concentration with Chla (A), Chlb (B), Car (C), and Chl/Car ratio (D) in the leaves of rice and cucumber. The lines represent the regressions that are best fit for the data (n = 12). Chla, chlorophyll a content; Chlb, chlorophyll b content; Chl, chlorophyll content; Car, carotenoid content.

