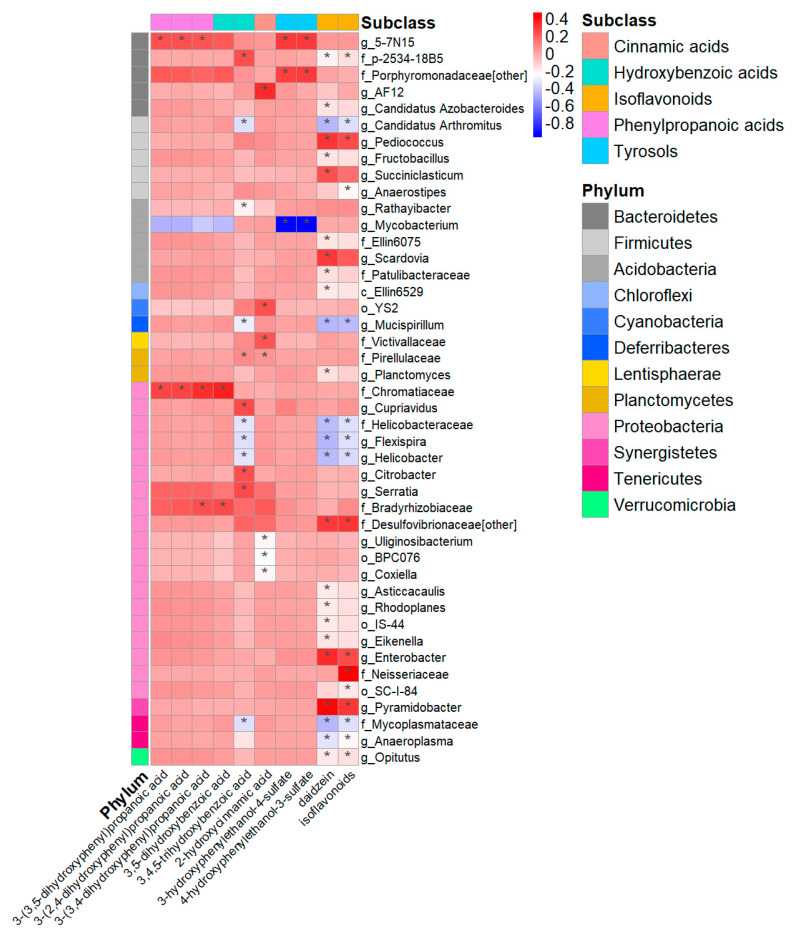
Figure 4.
Associations between the significant urinary metabolites in Figure 3 and genera in the TwinsUK cohort, adjusted for family relatedness, age, BMI, energy intake, and fibre intake. The colour scale indicates the effect (stdBeta) of each metabolite on taxa. Red and blue illustrate negative and positive effects, respectively, and colour intensity represents the degree of the effects. This figure only presents the genera with significant associations (*: all FDR-adjusted p < 0.05). BMI, body mass index.

