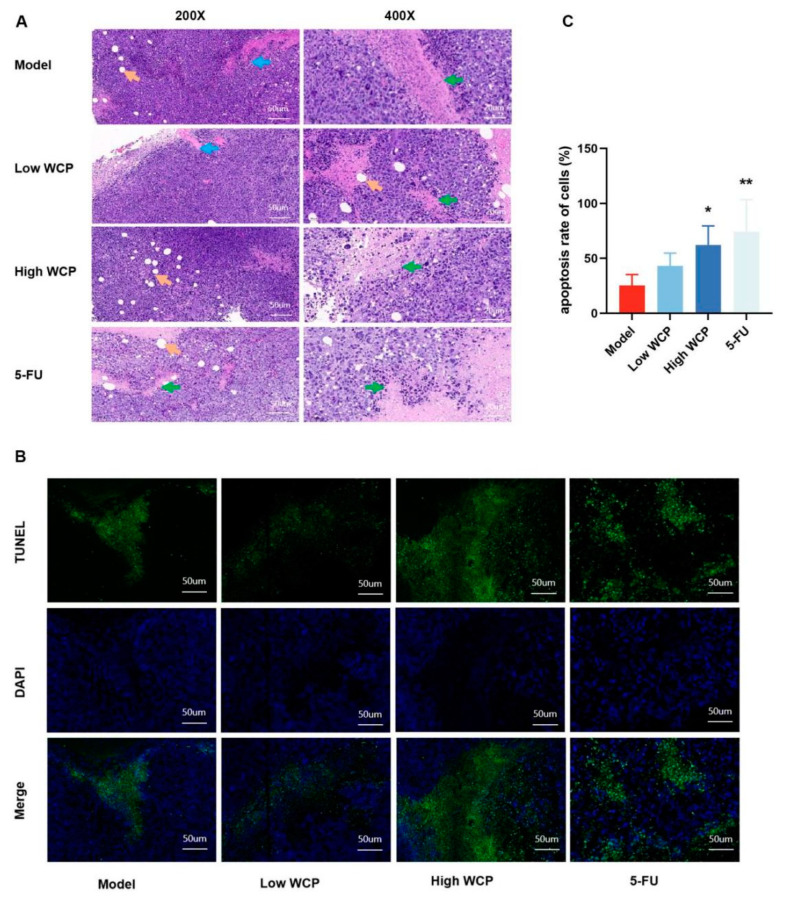
Figure 6.
WCP treatment promotes apoptosis of tumor cells. (A) HE staining of tumors (200×, 400×), scale bar = 50 µm and 20 µm. Green arrows represent necrotic tissue, orange arrows represent fat vacuoles, and blue arrows represent tumor cells invading muscle tissue. (B,C) TUNEL detection and proportions of tumor. * p < 0.05, ** p < 0.01 compared to model group.

