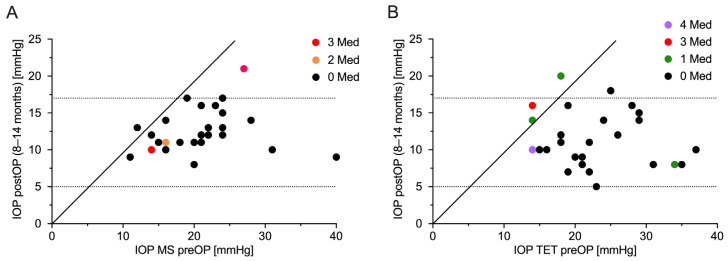
Figure 2.
Scatter plot of intraocular pressure preoperatively versus one year postoperatively. (A) MicroShunt implantation and (B) trabeculectomy. The dotted lines represent the limits of surgical success, plotted according to the number of antiglaucomatous medications at one year postoperatively. IOP = intraocular pressure; MS = MicroShunt implantation; Med = antiglaucomatous medication; preOP = preoperative; postOP = postoperative; TET = trabeculectomy.

