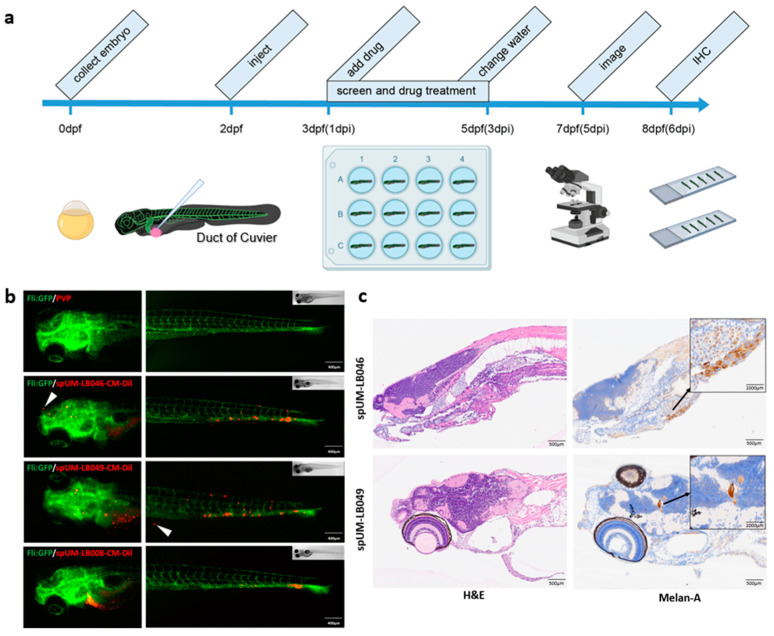
Figure 3.
Establishment of zebrafish patient-derived xenograft model. (a) The timeline of drug treatment in the zebrafish xenograft assay: collection of embryos (0 dpf), UM cell injection (2 dpf), drug administration (1–5 dpi), imaging or IHC staining (6 dpi). (b) The fluorescent images of whole zebrafish engrafted without and with spheroid-derived cells at 5 dpi. The cells disseminated into the caudal hematopoietic tissue (CHT), while some cells remained at the injection site. The white arrows in the images of spUM-LB046 and spUM-LB049 point to extravascular cells. Images were taken with 20× magnification. The scale bar is 400 µm. (c) H&E and Melan-A staining of spUM-LB046 and spUM-LB049 at 6 dpi. The Melan-A images in black magnification showed the metastasis of UM cells in the brain of engrafted zebrafish embryos. The scale bar is 500 µm.

