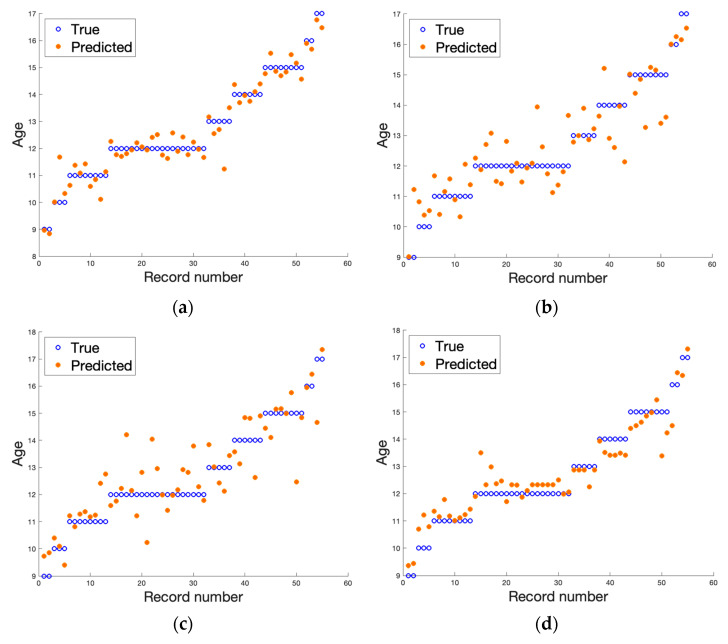
Figure 3.
The result of regression algorithms for all cases examined for data describing bone images (metric). The real age is presented by blue circles and estimated age with a regression algorithm is depicted by orange dots. The samples are ordered on the y axis with increasing age. (a) DICOM T1-weighted, (b) DICOM T2-weighted, (c) PNG T1-weighted, and (d) PNG T2-weighted.

