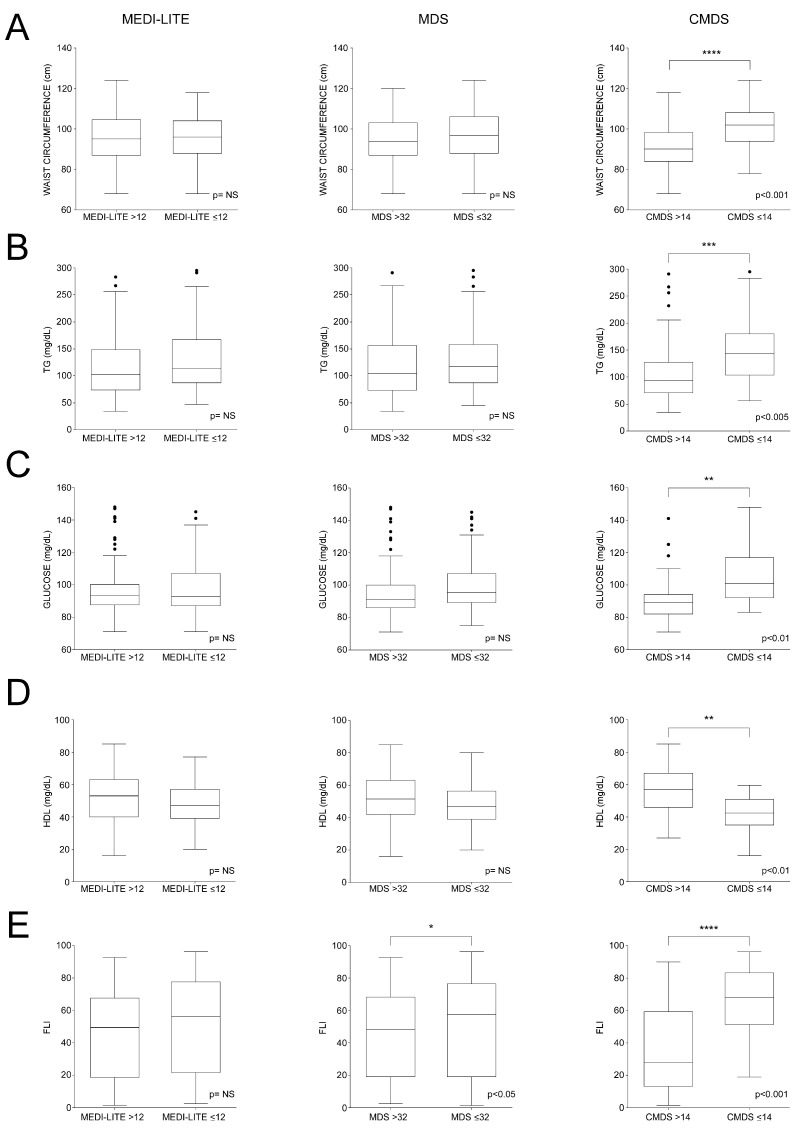
Figure 6.
Dysmetabolic-related biomarkers in subgroups population identified according to MEDI-LITE, MDS, and CMDS cut-offs. Box plots show median (second quartile), first and third quartile. Tukey whiskers reach 1.5 times the interquartile distance or the highest or lowest point, whichever is shorter. Any data beyond whiskers are shown black dots. Comparisons were performed using Students’ t test. * p < 0.05, ** p < 0.01, *** p < 0.005; **** p < 0.001 indicates statistical significance. Abbreviations: triglycerides, TG; high-density lipoprotein cholesterol, HDL; Fatty Liver Index, FLI. (A) Box plots of waist circumference according to MEDI-LITE, MDS and CMDS cut-offs; (B) Box plots of triglycerides according to MEDI-LITE, MDS and CMDS cut-offs; (C) Box plots of glucose according to MEDI-LITE, MDS and CMDS cut-offs; (D) Box plots of high-density lipoprotein cholesterol according to MEDI-LITE, MDS and CMDS cut-offs; (E) Box plots of Fatty Liver Index according to MEDI-LITE, MDS and CMDS cut-offs.

