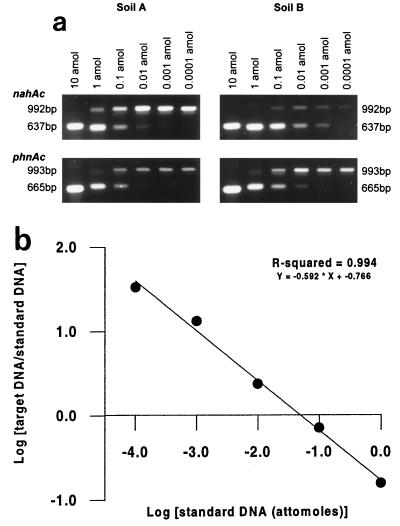
FIG. 1.
(a) QC-PCR of phnAc and nahAc amplified from two contaminated soils. Soil A was derived from a former town gas-generating site and contained high levels of PAHs. Soil B was contaminated with petrochemicals and contained low levels of PAHs. The upper band in each QC-PCR titration series contained the target amplicon (unknown); the lower band consisted of amplicons derived from the standard DNA. The amounts of standard DNA used (10 to 0.0001 amol) are indicated above the lanes. (b) Representative plot of the ratio of target DNA intensity to standard DNA intensity plotted against the initial concentration of standard DNA on logarithmic scales. Band intensities were quantified by processing images of Polaroid photographs of SYBR Gold-stained gels. The plot is not a representation of panel a.

