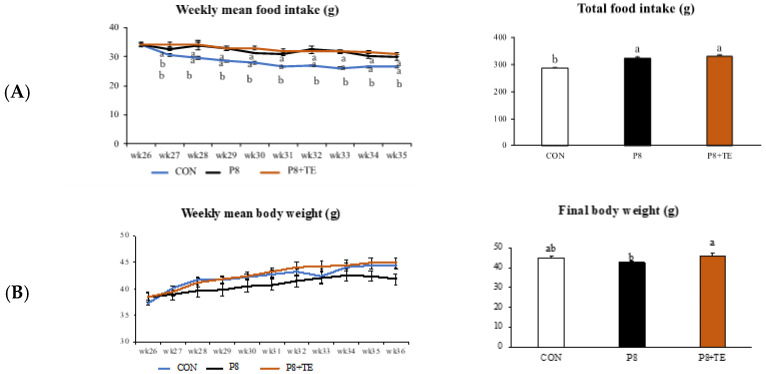
Figure 1.
General characteristics of CON, P8, and P8-TE groups from 26th to 36th week. (A) Weekly mean food intake and total food intake for all groups. (B) Weekly mean body weight and final body weight for all groups. All values are mean ± standard error (SE) (n = 6–7) via Tukey’s test. (CON, control: SAMR mice with normal diet; P8, SAMP8 mice with normal diet; P8 + TE, SAMP8 mice with turmeric extract (TE)-supplemented diet).

