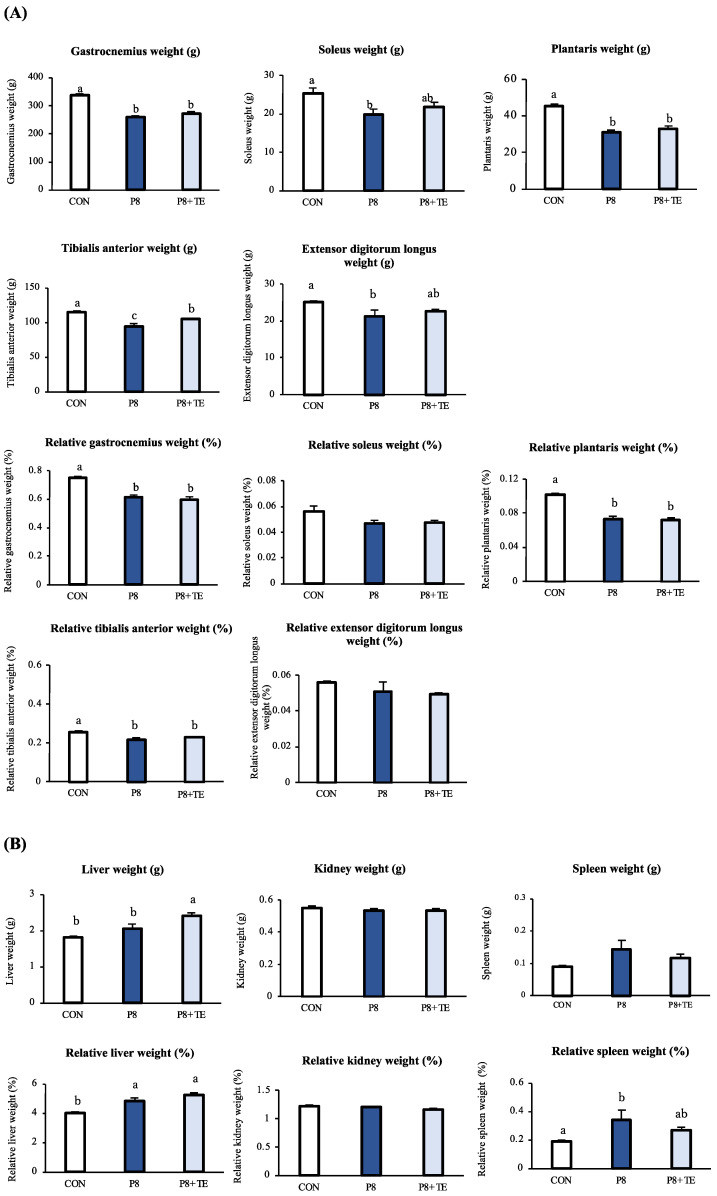
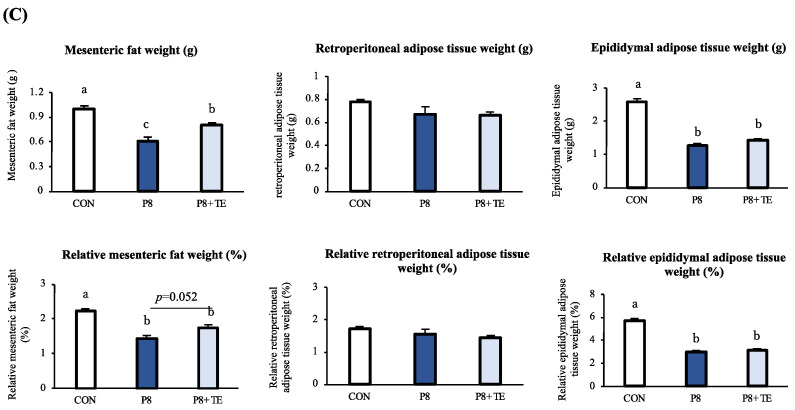
Figure 2.
Changes in fat mass, organ weight, and muscle mass of the mice across CON, P8, and P8-TE groups. (A) Weight (g) and relative weight (by weight, %) of gastrocnemius, soleus, plantaris, tibialis anterior, and extensor digitorum longus. (B) Weight (g) and relative weight (by weight, %) of liver, kidney, and spleen. (C) Weight (g) and relative weight (by weight, %) of mesenteric fat, retroperitoneal adipose tissue, and epididymal adipose tissue. All values are mean ± SE (n = 6–7) via Tukey’s test.


