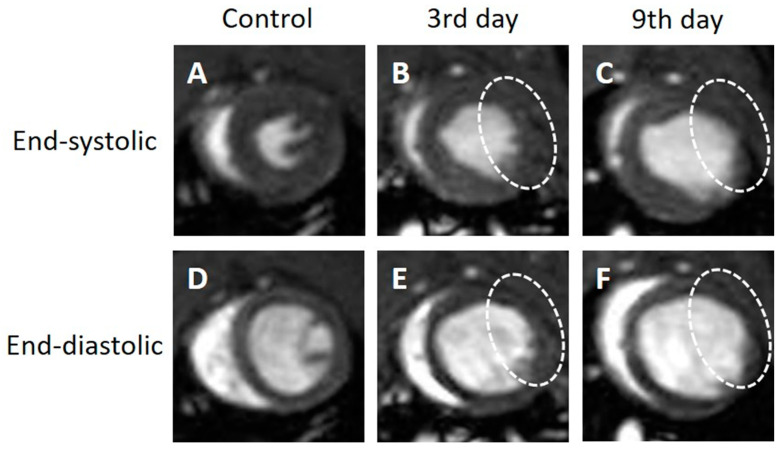
Figure 3.
Representative short-axis view cine magnetic resonance images. Control (A,D), 3 days after the onset of myocardial infarction (B,E), 9 days after the onset of myocardial infarction (C,F). End-systolic phase of the rat heart (A,B,C), end-diastolic phase of the rat heart (D,E,F). White dotted circles: infarcted area.

