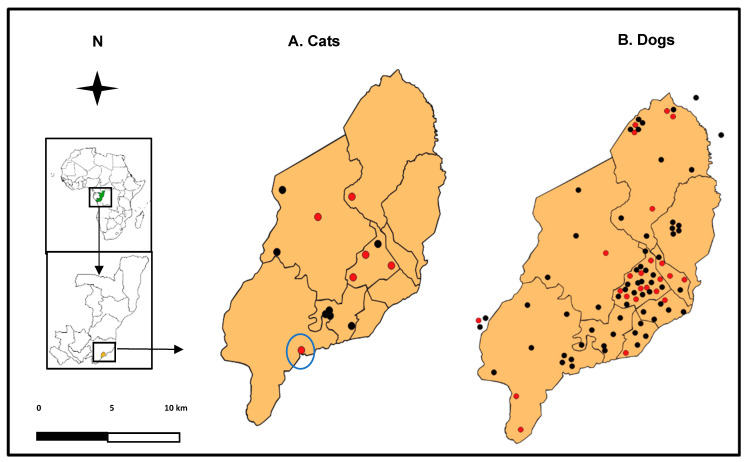
Figure 1.
Maps of Brazzaville (RoC) showing the distribution of households where cats (A) and dogs (B) were sampled. Red and black dots represent the pets that tested positive and negative, respectively, for SARS-CoV-2. The cat with a putative recombinant variant is highlighted with a blue circle. Map data source: www.arcgis.com accessed on 3 February 2022.

