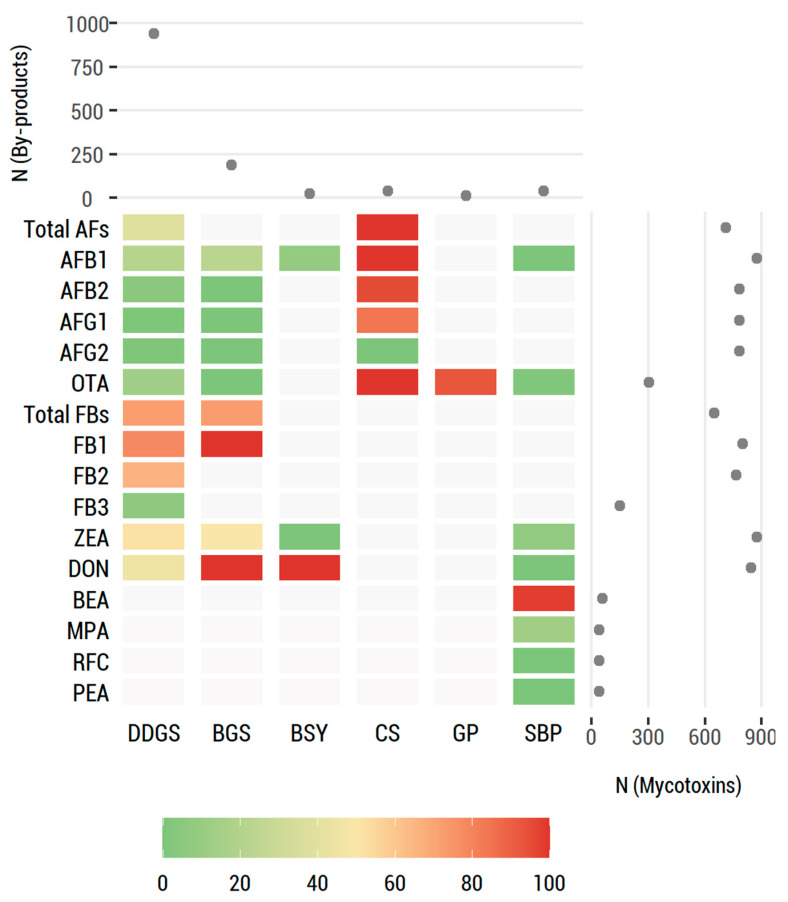
Figure 3.
Distribution of mycotoxins studied in food industry by-products, sorted by category (DDGS, BSG, BSY, CS, GP, and SBP). The heatmap summarizes the prevalence of mycotoxins in 6 by-products. Each heatmap cell shows the percentage of positive samples for a given mycotoxin and by-product through a chromatic scale (from dark green (low values) to dark red (high values)). Gray cells correspond to missing values. The right-hand scatterplot displays the number of samples included in the studies by mycotoxin. The upper scatterplot displays the number of samples included in the studies by by-product.

