
Figure 1. Histone deacetylase inhibitors stabilize Rae-1 expression on tumor cells.
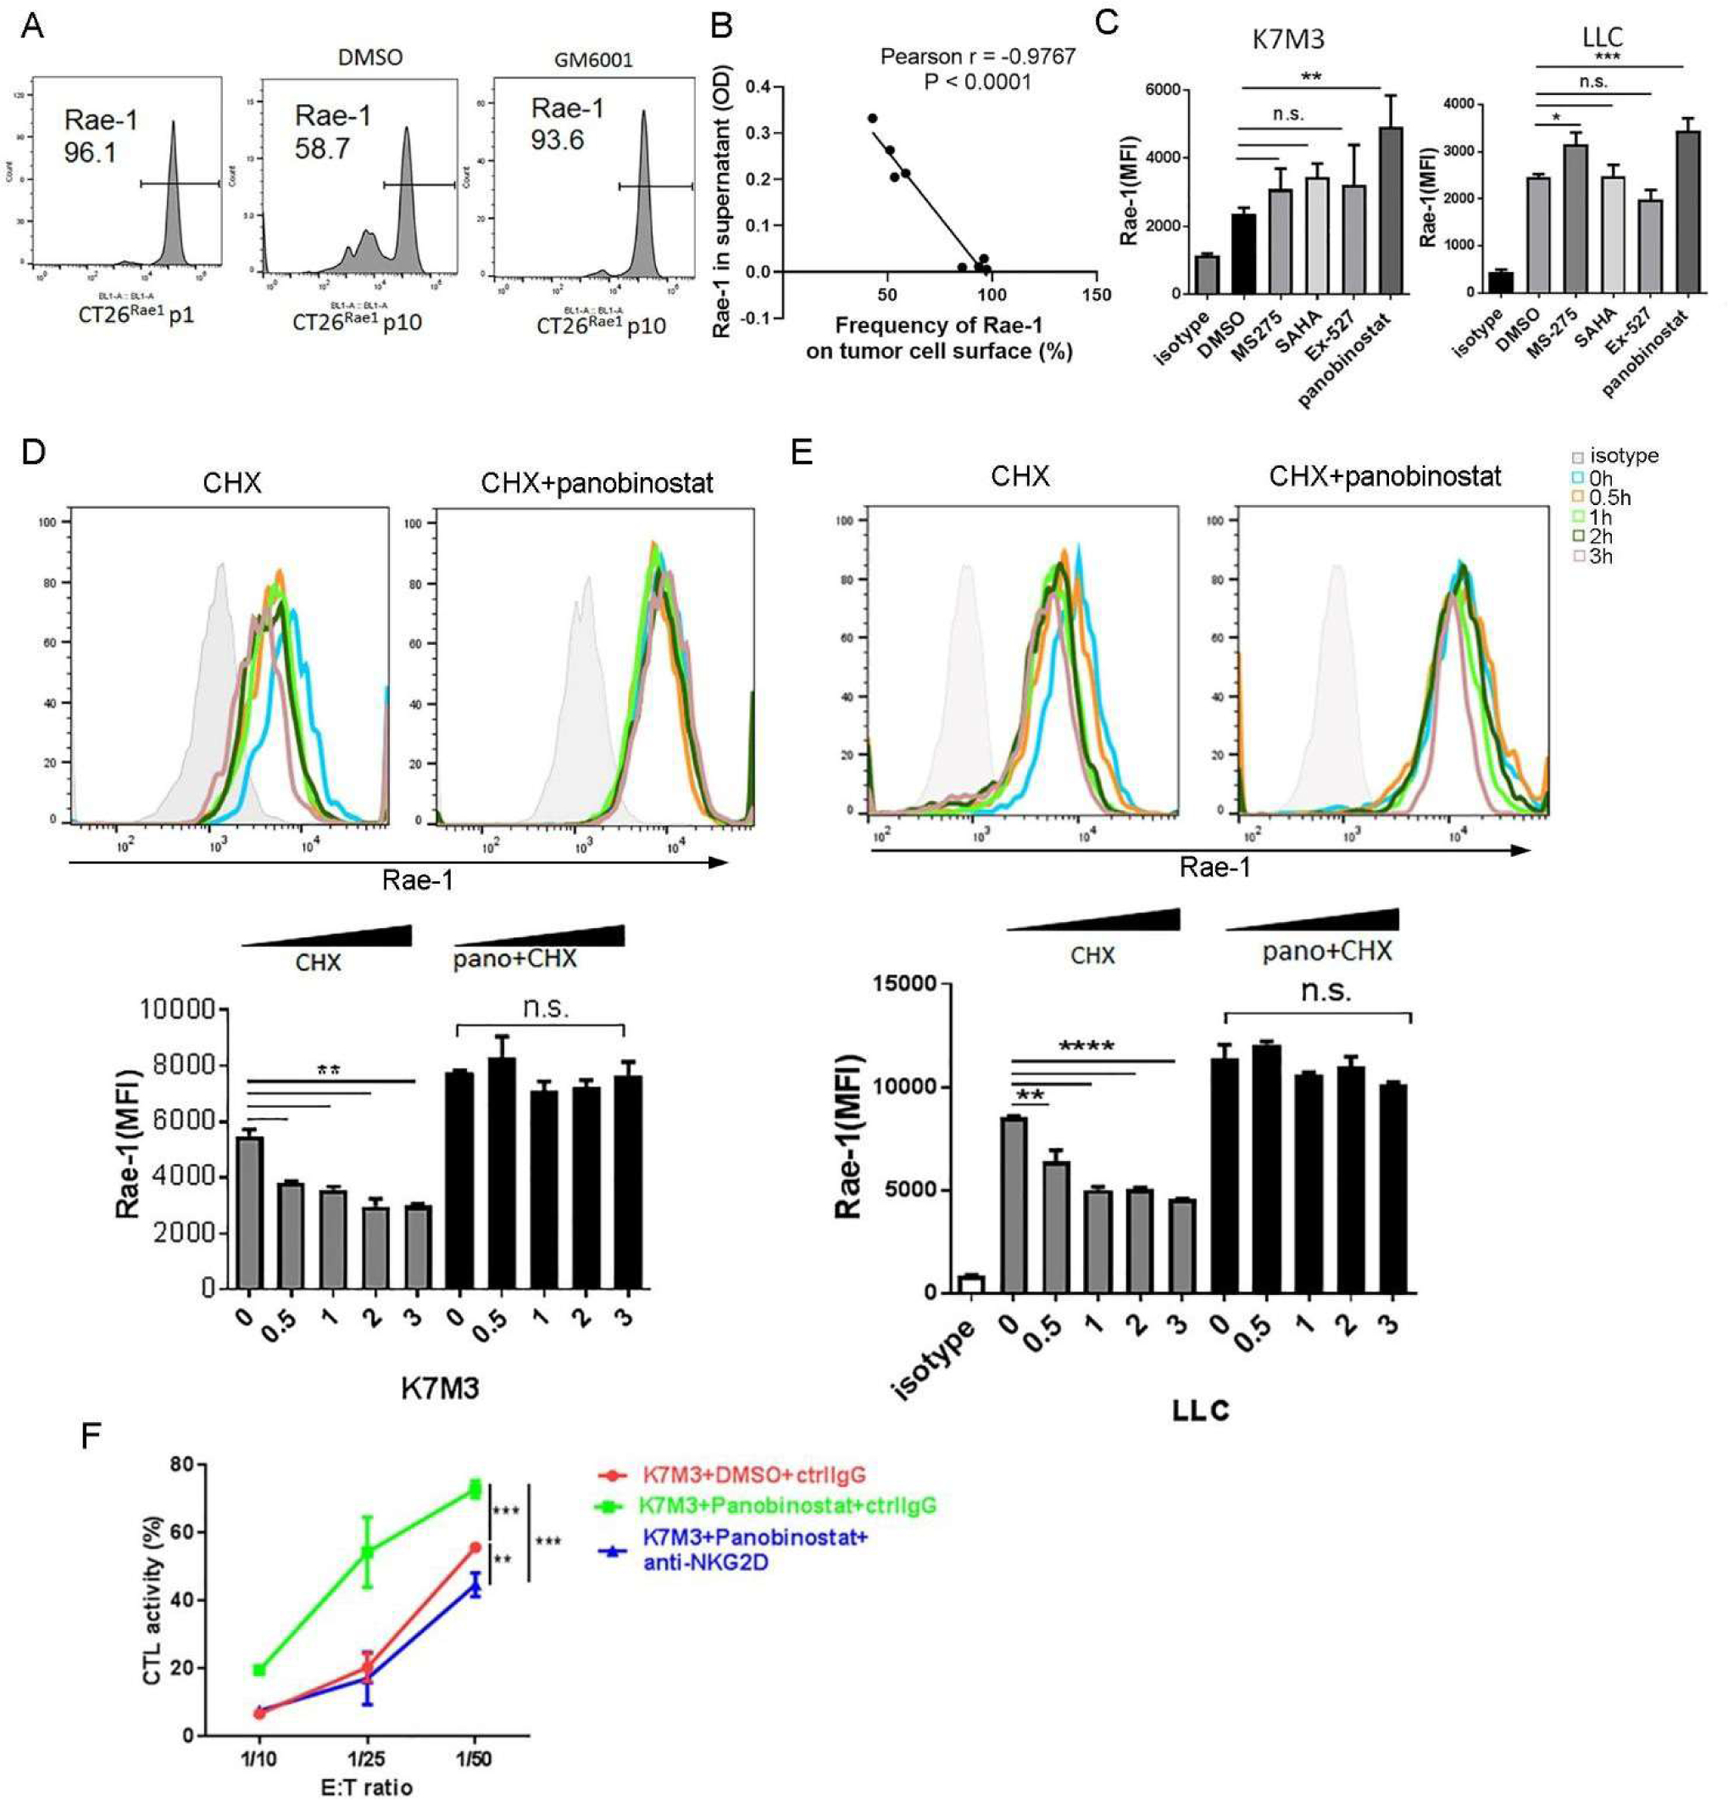
(A) CT26Rae1 cells at passage 10 were treated with DMSO or the MMP inhibitor GM6001 (10 μM) for 24 hours. Rae-1 expression on the surface of CT26Rae1 cells at passage 1 and passage 10 was determined using flow cytometry. (B) Soluble Rae-1 in the cell culture supernatant of CT26Rae1 cells at different passages was determined using ELISA. The frequency of cell surface Rae-1 on CT26Rae1 cells at different passages was determined using flow cytometry. Correlation of cell surface Rae-1 (%) and soluble Rae-1 (OD) was determined by the Pearson’s product moment test. (C) K7M3 and LLC cells were treated with DMSO, MS-275 (5 μM), SAHA (5 μM), EX-527 (5 μM), or panobinostat (100 nM) for 24 hours, and Rae-1 levels were measured using flow cytometry. Bar graphs show the mean fluorescence intensity (MFI) of Rae-1. (D, E) K7M3 (D) and LLC (E) cells were pretreated with DMSO or panobinostat (100 nM) for 1 hour and then treated with cycloheximide (CHX; 1 μg/mL) for 30 minutes or 1, 2, or 3 hours. Rae-1 expression was determined using flow cytometry. Bar graphs show the MFI of Rae-1 on the cell surface. (F) Cytolytic killing activity of splenocytes that were stimulated with CD3/CD28 antibodies against K7M3 cells treated with DMSO or panobinostat (100 nM) in the presence or absence of an anti-NKG2D blocking antibody at the indicated ratios for 5 hours. *P < 0.05; **P < 0.01; ***P < 0.001; ****P < 0.0001; NS, not significant.