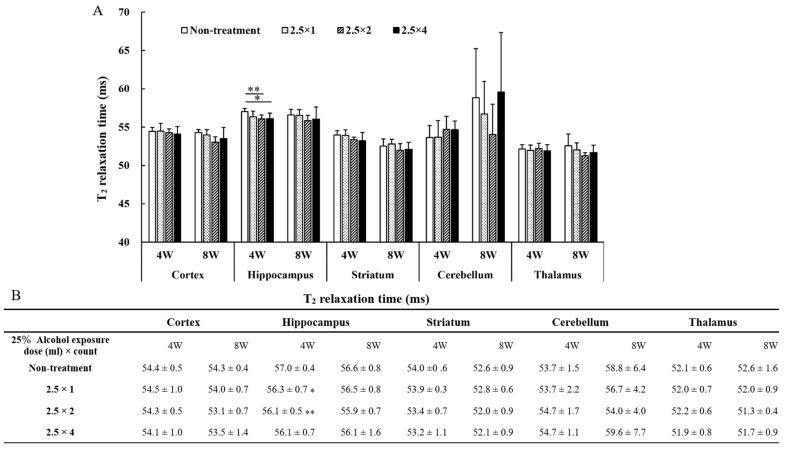
Figure 4.
The T2 values measured in each brain region are shown in graph (A) and table (B). Between-group comparisons were analyzed by one-way ANOVA with Tukey’s multiple comparison tests using Prism 9. T2 values were lower in the two- and four-dose groups compared with those of the non-treated group (* p < 0.05, ** p < 0.01). There were no significant differences among the three FASD groups, there was a significant difference only between the non-treatment and the FASD groups (2.5 × 2, 2.5 × 4). Therefore, the FASD group that was significantly different for non-treatment is indicated with an asterisk.

