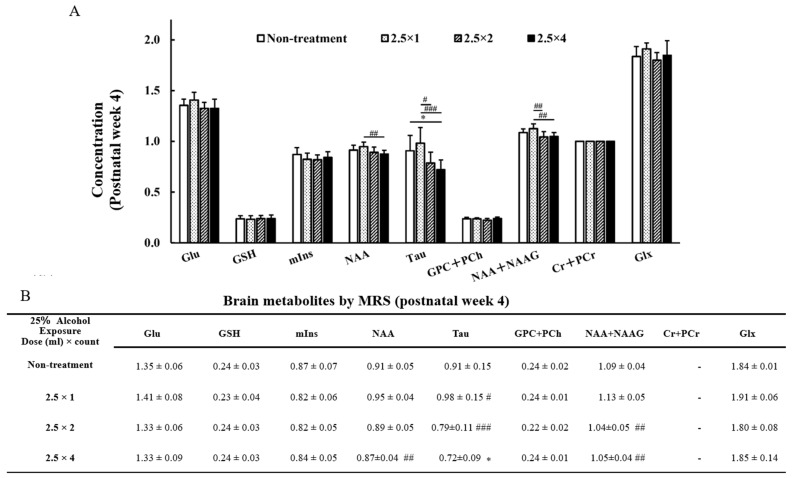
Figure 6.
Graph (A) and Table (B) of brain metabolites on MRS at 4 weeks of age: glutamine (Glu), glutathione (GSH), Myo-inositol (mIns), N-acetyl aspartate (NAA), Taurine (Tau), glycerophosphocholine + phosphocholine (GPC + PCh), N-acetyl aspartate + N-acetyl aspartyl glutamate (NAA + NAAG), creatine + phosphocreatine (Cr + PCr), and glutamine + glutamic acid (Glu + Gln). The results of the comparison between the four-groups (non-treatment, 2.5 × 1, 2.5 × 2, and 2.5 × 4) are shown. Between-group comparisons were analyzed by one-way ANOVA with Tukey’s multiple comparison tests using Prism 9. The results showed no significant difference between the two-dose group (2.5 × 2) and the four-dose group (2.5 × 4). As compared with the non-treatment group: * p < 0.05. As compared with the one-dose FASD group (2.5 × 1): # p < 0.05; ## p < 0.01; ### p < 0.001.

