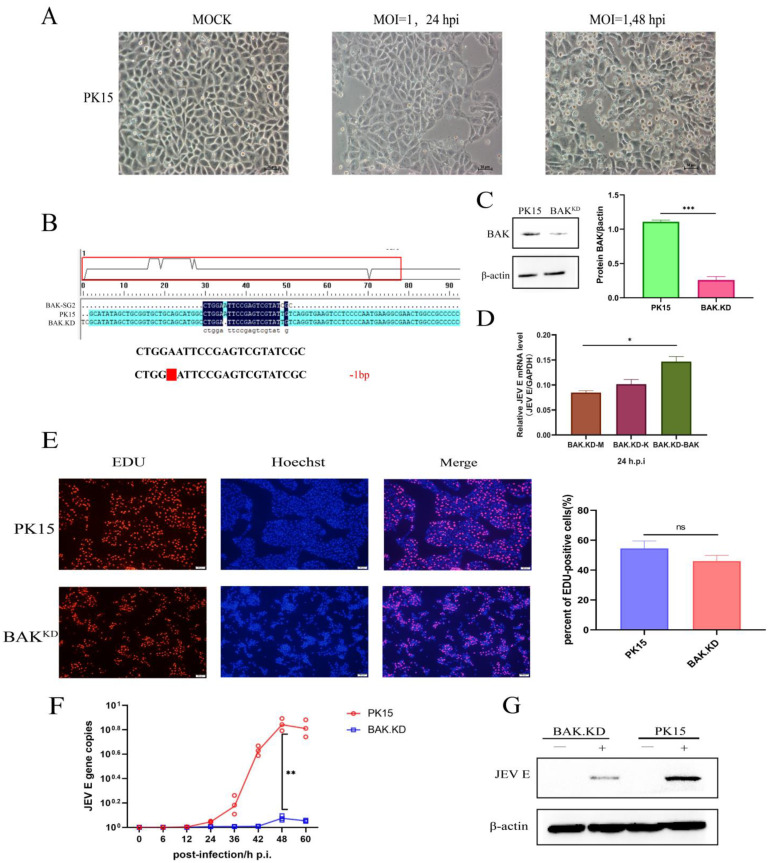
Figure 1.
Proliferation of JEV is inhibited in BAK.KD cells. (A) Normal PK15 cells were infected with JEV at MOI = 1, and cell death was observed at 24 and 48 h. (B) Sequence alignment between BAK.KD cells and normal cells (located at the porcine-derived BAK whole-genome DNA (No.29811711–No.29811736). A red blank represents a missing base. (C) WB identification of BAK protein expression in BAK.KD and normal cells; knockdown resulted in extremely significant protein reduction *** (p < 0.001) using grayscale quantification. (D) The BAK eukaryotic expression plasmid was transfected into cells for BAK gene complementation experiments. M, blank group; K, empty vector plasmid group; BAK, experimental group transfected with BAK plasmid. (E) PK-15 cells and BAK.KD were loaded with EdU and incubated for 2 h. After waiting for the reaction, photographs were taken with a fluorescent microscope, EdU-positive cells are colored in red, and nuclei are colored in blue. At least 3 photos were taken of each sample. Finally, the percentages of EdU-positive cells were calculated separately, and the average was taken as the final data. (F) Cells in a T75 cell flask were infected with JEV virus titers at MOI = 1. After replacement with 20 mL of 2% serum DMEM as the maintenance solution, 500 µL of supernatants was collected at different times, and viral RNA was extracted and reverse transcribed into cDNA. Viral copy number changes were detected by absolute fluorescence quantification, and growth curves were drawn. (G) Western blot was used to quantify proteins in cells. The experimental (JEV, MOI = 1, 48 hpi) group and control group illustrate the expression level of JEV E protein. All samples were run in triplicate, and the results were averaged for processing. * (p < 0.05), ** (p < 0.01), *** (p < 0.001), and ns (not significant).

