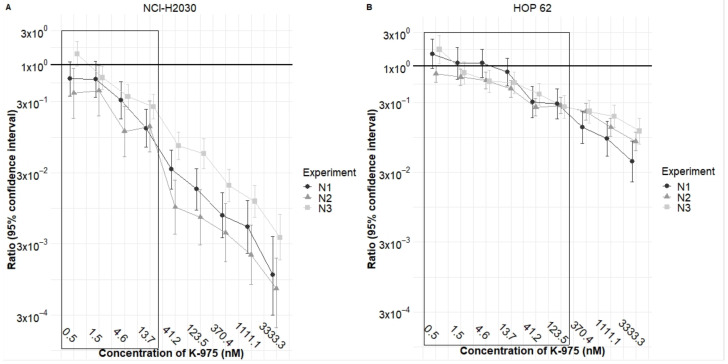
Figure 2.
K-975 potentiates adagrasib in HOP 62 and NCI-H2030 cell lines. This graph shows the ratio values obtained for adagrasib either as a single agent or combined with increasing concentrations of the K-975 inhibitor. (A) Confirmatory study with the NCI-H2030 cell line shows the potentiation effect that is statistically evident for the four concentrations at which K-975 is entirely inactive as a single agent. (B) Confirmatory study with the HOP 62 cell line shows the potentiation effect that is statistically evident for six concentrations at which K-975 is entirely inactive as a single agent. The boxed values in panels A and B show the ratio of the potentiation effect of adagrasib when K-975 is used at doses where it is completely inactive as a single agent. Geometric means and SD were calculated for three independent experiments (N1, N2, N3).

