Figure 5.
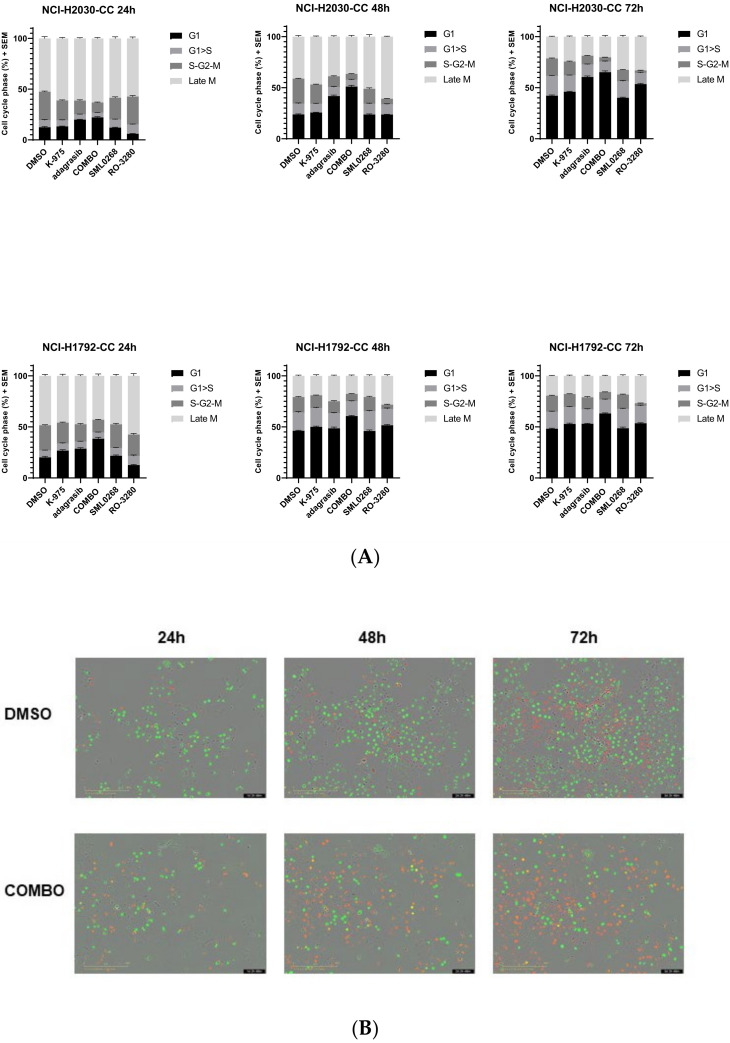
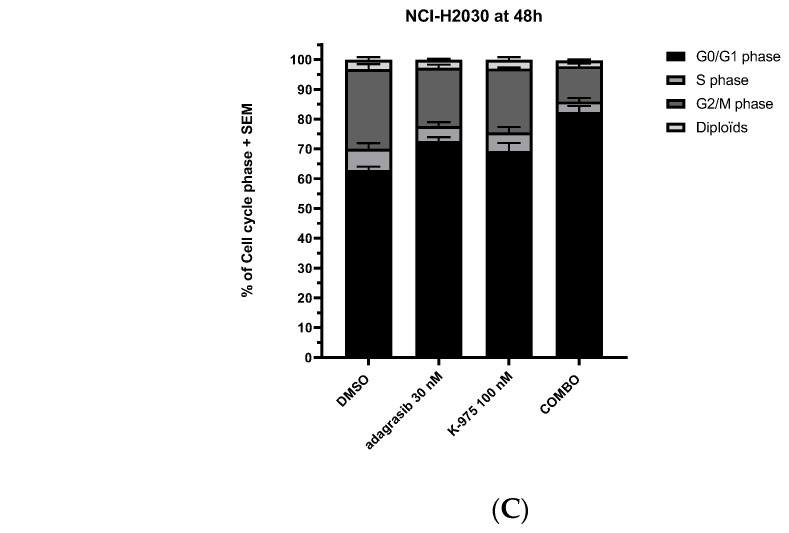
Cell cycle analysis and FACS detection show an arrest in the G0/G1 and G2/M phases. (A) Time course on cell cycle analysis. Histograms representing different phases of the cell cycle. The analysis was performed using NCI-H2030 (NCI-H2030-CC) and NCI-H1792 (NCI-H1792-CC) modified with lentivirus (Sartorius). The conditions analyzed were DMSO, K-975 at 100 nM, adagrasib at 30 nM, and COMBO (adagrasib and K-975 at the selected doses). Representative figures from at least two biological replicates (BR) of the different conditions were analyzed at 24, 48, and 72 h. Aurora B Kinase (SML0268) and PLK1 (RO-3280) inhibitors were used as control. Cell cycle phases analyzed were: G1, G1 > S (Transition), S-G2-M, and Late M. (B) Representative photos of time course on NCI-H2030-CC cell line. Conditions analyzed: DMSO and COMBO. The cell carpet is represented by cycling cells (green cells), while in the combination, the cell-confluency is rarer, and the cells are arrested in G1 (red cells). Details are described in Section 4. (C) Cell cycle analysis via FACS procedure at 48 h. Validation via propidium iodide of the DNA content. Conditions analyzed: DMSO, K-975 (100 nM), adagrasib (30 nM), COMBO (adagrasib and K-975). The image represents three biological replicates.


