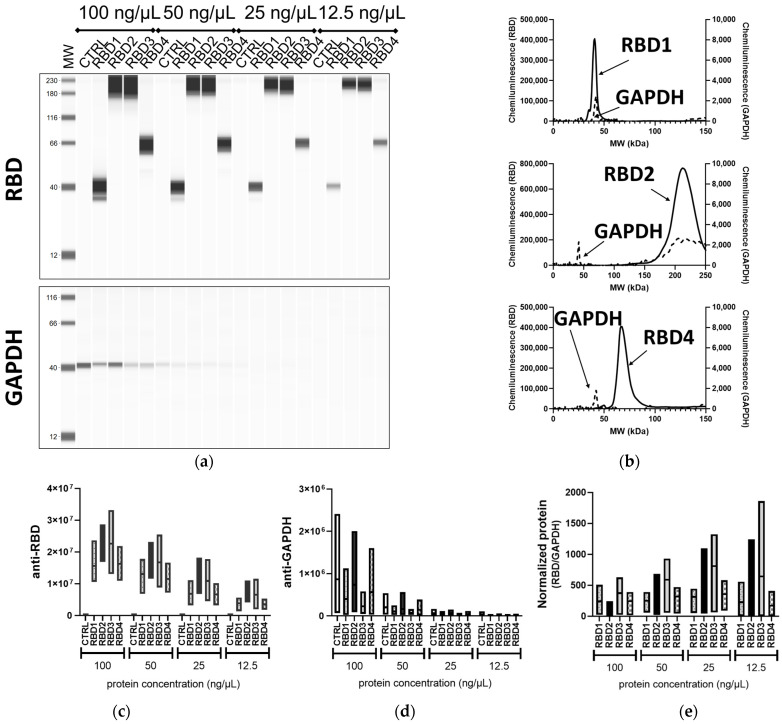
Figure 4.
Assessment of transgene expression by JESS Simple Western™. Different concentrations (100, 50, 25, 12.5 ng/µL) of lysates from 293T cells transfected with vectors expressing RBD containing transgenes of different sizes (RBD1–4) or control transgene (CTRL) were processed in the fully automated JESS Simple Western™ device, probed with the SARS-CoV-2 RBD (1:50) and GAPDH (1:10) Abs. (a) Portrayal of a traditional blot-like image with a lane view of the samples. (b) An electropherogram representation of RBD1, RBD2, and RBD4 (50 ng/µL) samples for both the anti-RBD (solid line) and anti-GAPDH (dashed lines) analysis. Floating bar diagrams (minimum, maximum, and mean) of the peak areas corresponding to RBD (c) and GAPDH (d) protein from three independent experiments. (e) Floating bar diagram (minimum, maximum, and mean; n = 3) of the normalized RBD expression calculated from the peak areas of RBD and GAPDH signals.

