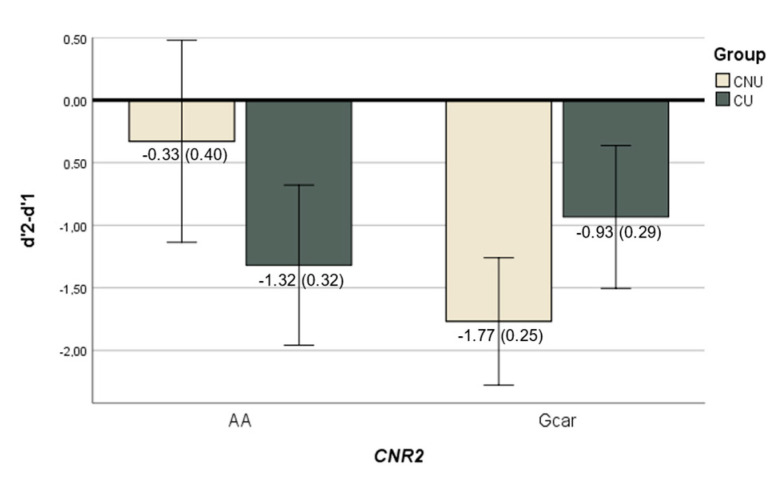
Figure 3.
Bar plot showing the significant interaction between CNR2 CNR2 (rs2501431) × cannabis use (CNU—cannabis non-users; CU—cannabis users) in the n-back task performance. Each bar represents the marginal mean of the d′2-d′1 score (±2SE) (which measures the behavioural response to the increased difficulty of the task), separately by genotypes and cannabis use groups.

