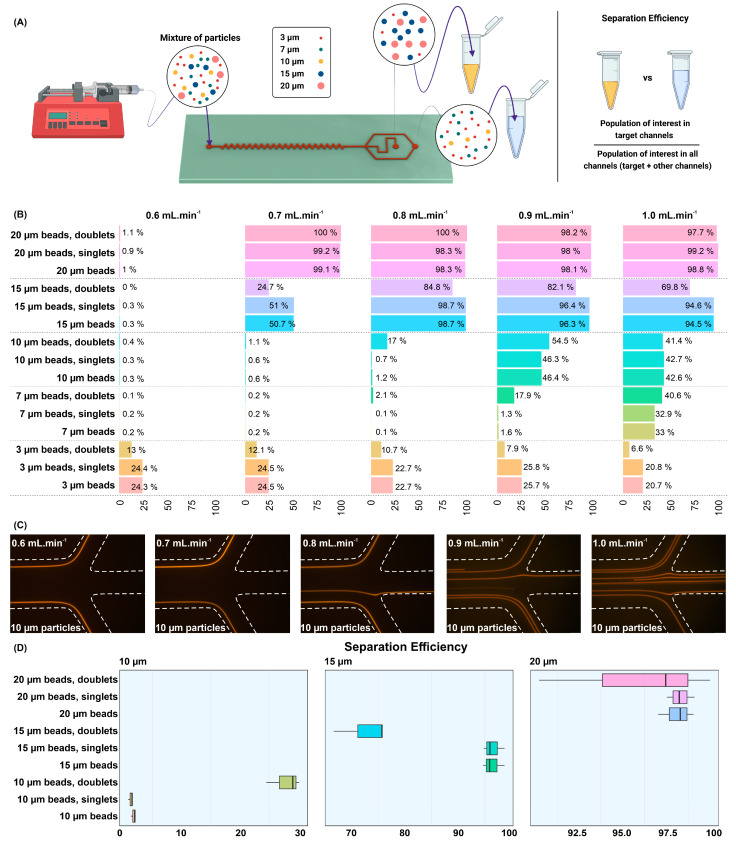
Figure 3.
Result from a flow rate titration on a 3D printed inertial focusing device. (A) Shows the system setup and a visual representation of how samples are collected, and calculations of SE were made for the central channel, which, in this case, is designed to enrich cells/particles that are above ~12 um. (B) Shows the SE as calculated using the gating method shown in Figure 2 for all bead populations tested at different flow rates. Shown here, also, are the SE values for the singlet and doublet events for each bead size. (C) Shows the results from a traditional fluorescence trace experiment. These results clearly indicated that (i) the result from each method is similar, the fluorescent trace analysis only shows performance at a single point in time, there is no way to quantify the results based on fluorescent streak analysis, and it is not possible to analyze the behavior of doublets or cluster using fluorescent imaging. (D) Shows the reproducibility of our method to calculate SE over three independent experiments.

