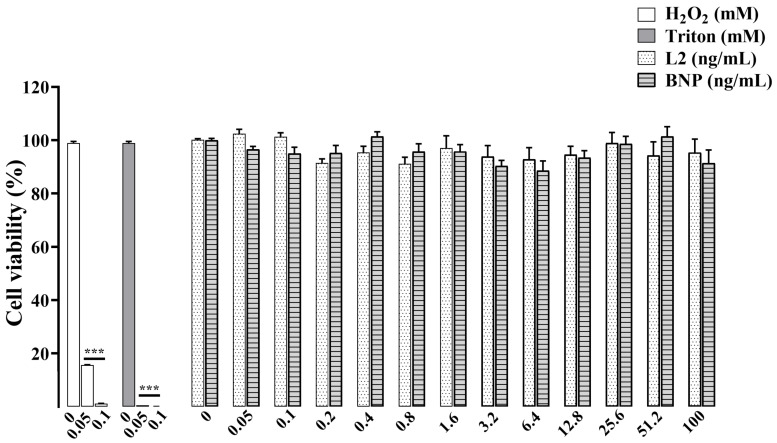
Figure 1.
Cell viability by MTT assay on RAW 264.7 cells. Cells were exposed for 24 h to H2O2 or Triton (0.05 and 0.1 mM), and to L2 or BNP (0.05, 0.1, 0.2, 0.4, 0.8, 1.6, 3.2, 6.4, 12.8, 25.6, 51.2 and 100 ng/mL). n = 8–9/condition. Data are reported as mean ± SEM. *** p < 0.001 vs. corresponding untreated control group.

