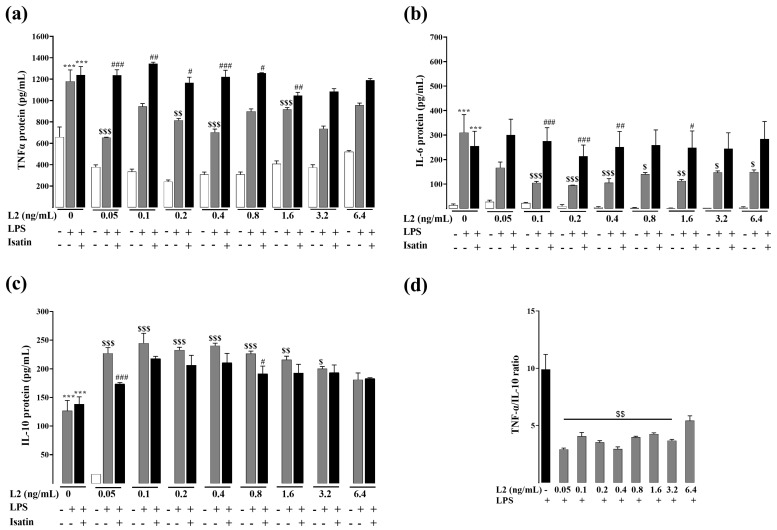
Figure 2.
Effects of L2 on LPS-induced inflammatory cytokines by ELISA assay. Levels of (a) TNF-α, (b) IL-6 and (c) IL-10, and (d) TNF-α/IL-10 ratio after L2 treatment of LPS-activated RAW 264.7 cells. After LPS (1 µg/mL) priming for 24 h, cells were treated with different concentrations of L2 (0, 0.05, 0.1, 0.2, 0.4, 0.8, 1.6, 3.2 and 6.4 ng/mL) for 24 h to determine TNF-α and IL-6, and for 48 h to assess IL-10 levels. Natriuretic peptide receptor antagonist isatin (0.1 mM) was added 20 min before L2 treatment. n = 3–6/condition. Data are reported as mean ± SEM. *** p < 0.001 vs. corresponding control LPS untreated group; $ p < 0.05, $$ p < 0.01, $$$ p < 0.001 vs. corresponding control L2 untreated group; # p < 0.05, ## p < 0.01, ### p < 0.001 vs. corresponding LPS + L2 treated group.

