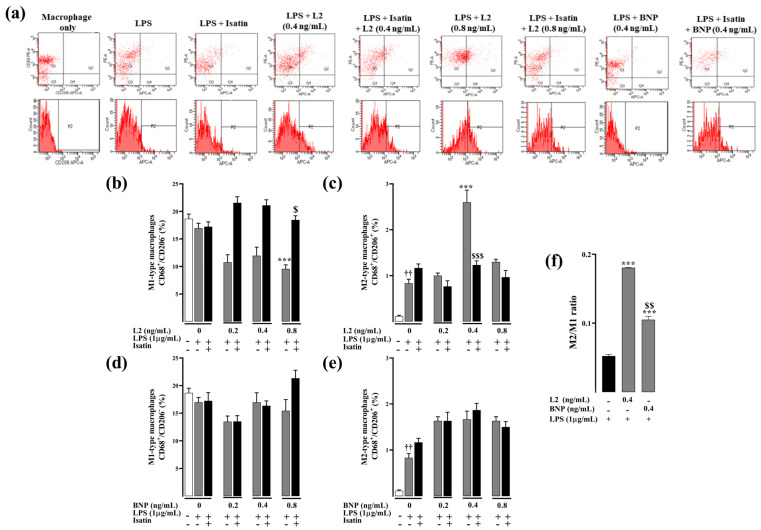
Figure 4.
Effect of L2 and BNP on macrophage polarization in LPS-activated RAW264.7 cells. (a) Representative flow cytometry plots showing the variable macrophage distribution of M1-like macrophages (CD68+/CD206− cells, Q1 population) and M2-like macrophages (CD68+/CD206+/MRC-1, Q2 population) in control and treated cells. (b,c) Effect of L2 on M1 and M2 macrophage subtype expression. (d,e) Effect of BNP on M1 and M2 macrophage subtype expression. Cells were obtained after challenging RAW264.7 cells with LPS (1 µg/mL) for 24 h followed by 48 h treatment with or without L2 or BNP (0, 0.2, 0.4 and 0.8 ng/mL) and isatin (0.1 mM), added 20 min earlier. (f) M2/M1 ratio in LPS-activated RAW264.7 cells. The subtypes of macrophages were identified by analyzing profiles of cell surface markers by FACS. Pro-inflammatory M1 macrophages were identified as CD68+/CD206ࢤ cells and M2-like macrophages assessed by double immunolabeling of CD68 and CD206/MRC-1 in control and treated cells, and the data were analyzed by BD CellQuestPro software. All results were obtained from duplicate experiments. Data are reported as mean ± SEM. *** p < 0.001 vs. corresponding control LPS group; $ p < 0.05, $$ p < 0.01, $$$ p < 0.001 vs. L2 corresponding group; †† p < 0.01 vs. group unstimulated with LPS.

