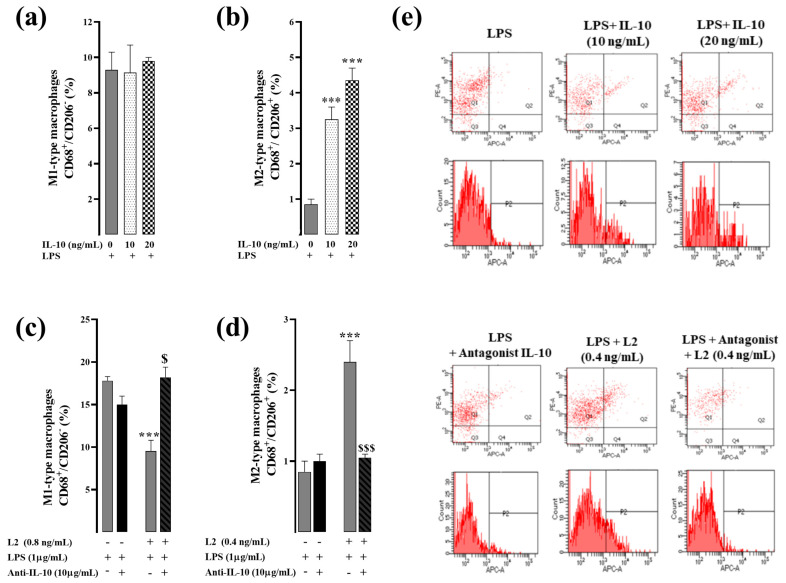
Figure 5.
Effect of L2 on macrophage polarization in LPS-activated RAW264.7 cells after interleukin-10 inhibition. (a,b) Effect of interlekin-10 (IL-10) on M1 and M2 macrophage subtype expression. Cells were obtained after challenging RAW264.7 cells with LPS for 24 h followed by 48 h treatment with or without exogenous IL-10 (0, 10 and 20 ng/mL). (c,d) Effect of L2 on M1 and M2 macrophage subtype expression after IL-10 inhibition. Cells were obtained after challenging RAW264.7 cells with LPS (1 µg/mL) for 24 h followed by 48 h treatment with or without L2 (0, 0.4 or 0.8 ng/mL) and IL-10 inhibitor at 10 µg/mL, added 20 min earlier. (e) Representative flow cytometry plots showing the variable macrophage distribution of M1-like macrophages (CD68+/CD206− cells, Q1 population) and M2-like macrophages (CD68+/CD206+/MRC-1, Q2 population) in control and treated cells. The subtypes of macrophages were identified by analyzing profiles of cell surface markers by FACS. Pro-inflammatory M1 macrophages were identified as CD68+/CD206− cells and M2-like macrophages assessed by double immunolabeling of CD68 and CD206/MRC-1 in control and treated cells, and the data were analyzed by BD CellQuestPro software. All results were obtained from duplicate experiments. Data are reported as mean ± SEM. *** p < 0.001 vs. corresponding control LPS group; $ p < 0.05, $$$ p < 0.001 vs. L2 corresponding group.

