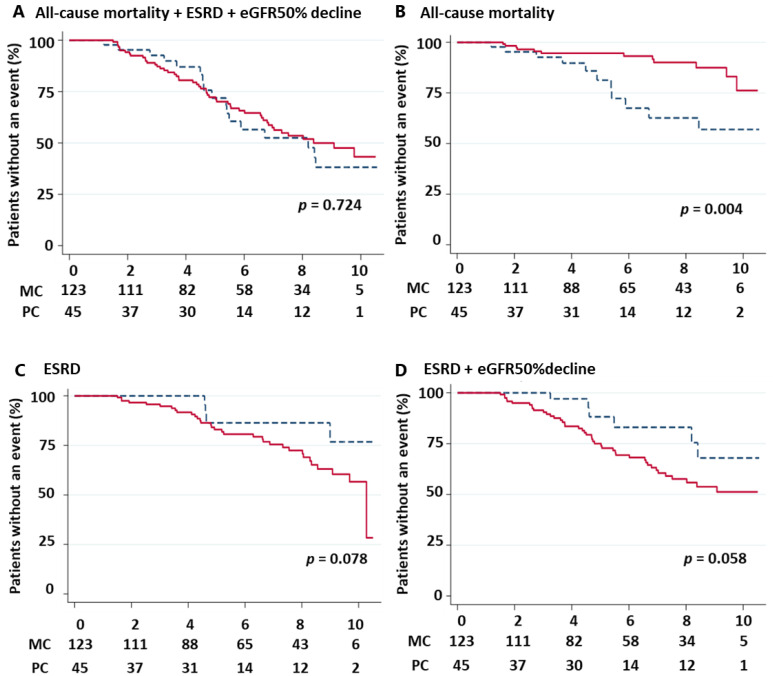
Figure 3.
Kaplan–Meier analyses for primary and secondary outcomes based on baseline medical cooperation. The red solid line represents the event-free time of the medical cooperation group. The blue dash line represents the event-free time of the primary care group. The survival curves were compared in medical cooperation for (A) All-cause mortality + ESRD + eGFR50% decline, (B) All-cause mortality, (C) ESRD, (D) CKD progression (ESRD + eGFR 50% decline). Abbreviation: MC, medical cooperation. PC, primary care; ESRD, end-stage renal disease.

