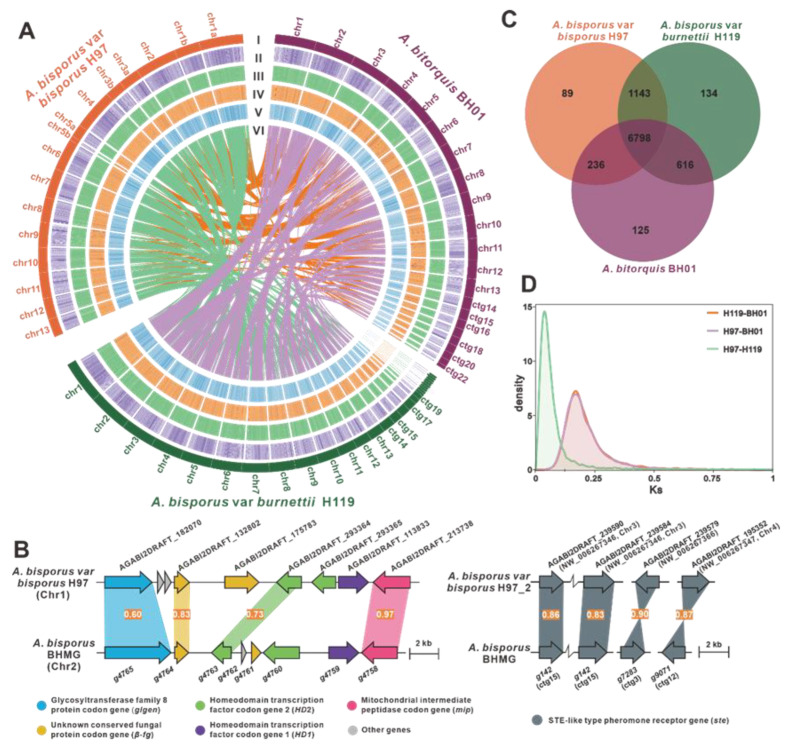
Figure 2.
Genomic characterization, mating-type loci, and comparative genomic analysis. (A) Genomic collinearity analysis between A. bitorquis and A. bisporus species. From the outside to the inside are I. Chromosome and Contigs; II–IV. GC-density, GC-skew, AT-skew (window size 10 kb), V. Gene-density (window size 100 kb), VI. Whole-genome collinearity analysis based on protein-coding genes between A. bitorquis and A. bisporus species. (B) Structural diagram of the genes on the matA locus and matB locus of A. bitorquis, the numbers on the similarity diagrams indicate the identity between corresponding genes. (C) Venn schematic of comparative genomes between A. bitorquis and A. bisporus species. (D) Ks comparison between A. bitorquis and A. bisporus species.

