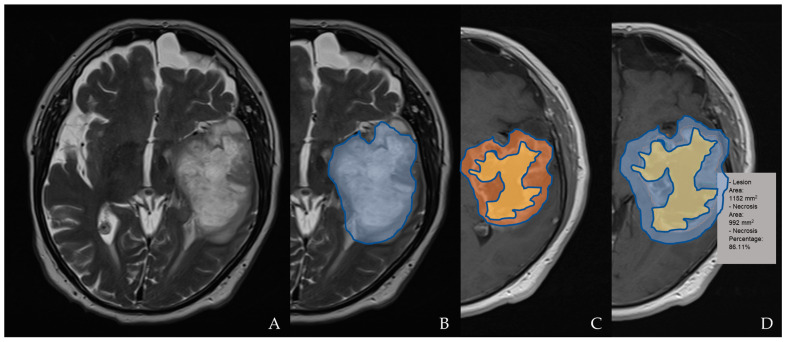
Figure 2.
An example of tumor segmentation for necrosis depiction. The segmentation of the T2 hyperintensity region designated as tumor invasion is shown in (A,B) on an axial plane (blue); the axial post-contrast T1WI shows segmentation of the necrotic area (yellow) compared to the enhancing tumor (orange; in (C)) and lesion/tumor area (blue; in (D)); the necrosis percentage is also calculated in (D).

