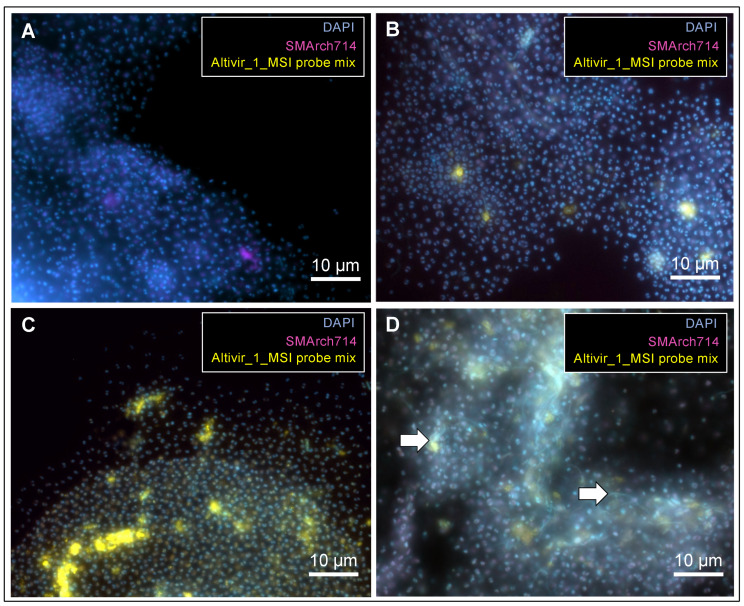
Figure 3.
VirusFISH shows how infections of Altiarchaeota with Altivir_1_MSI in biofilms could progress over time. Here independent biofilm flocks with different infections frequencies are depicted. Infection frequencies are based on viral abundances derived from all infection categories (1–3). (A) Biofilms show no to very few viral infections (low infection frequency). (B) The infection frequency increases. (C) The vast majority of host cells are infected. (D) Lysis of Ca. A hamiconexum cells appears to promote the enrichment of filamentous microbes along with cell debris. White arrows indicate filamentous microbes. Micrographs were taken according to Figure 1 and raw data is available under FigShare. For unmerged imaging data see Supplementary Material (Figures S6–SS9). Scale bar: 10 µm.

