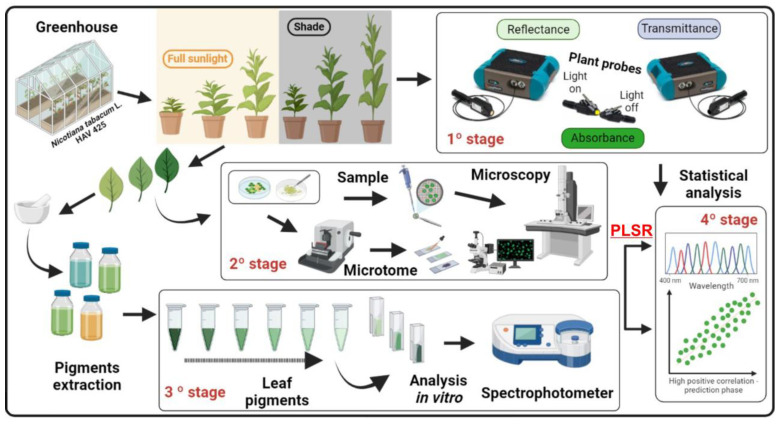
Figure 1.
Flowchart describing the prediction of chlorophylls and carotenoids in Nicotiana tabacum L., using one or two hyperspectral sensors. Plants are grown in a greenhouse under full sunlight or shading (1° stage), and their leaves are measured using single or two hyperspectral sensors. (2° stage), the leaves are analyzed using light and transmission electron microscopy. (3° stage), the pigments are quantified using classical destructive analysis with a spectrophotometer. (4° stage), the data are analyzed using PLS statistics.

