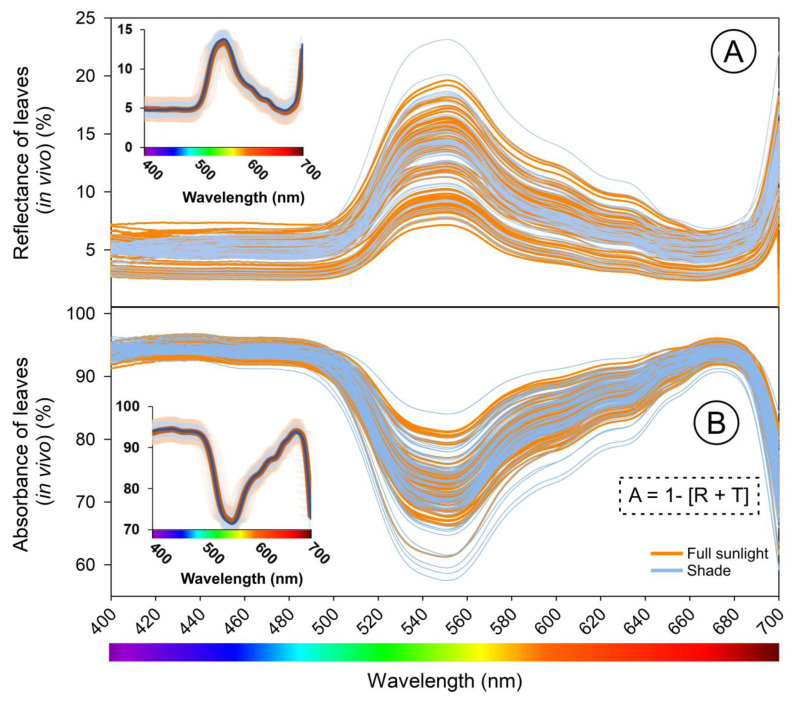
Figure 7.
Spectral leaf reflectance and absorbance (in vivo) curve from 400 to 700 nm in Nicotiana tabacum leaves of plants grown in a greenhouse with different growth stages and contents of gibberellin acid (GA3) or with paclobutrazol (PAC) and full sunlight and shade. (A) The reflectance curves were obtained with one of the spectroradiometers. (B) The absorbance curve was obtained by equation [A = 1 − (R + T)] (more details in Figure 1 and Figure 2). Insets on the left show the mean ± SE. Orange lines tobacco grown full sunlight and blue lines shade. (n = 150).

