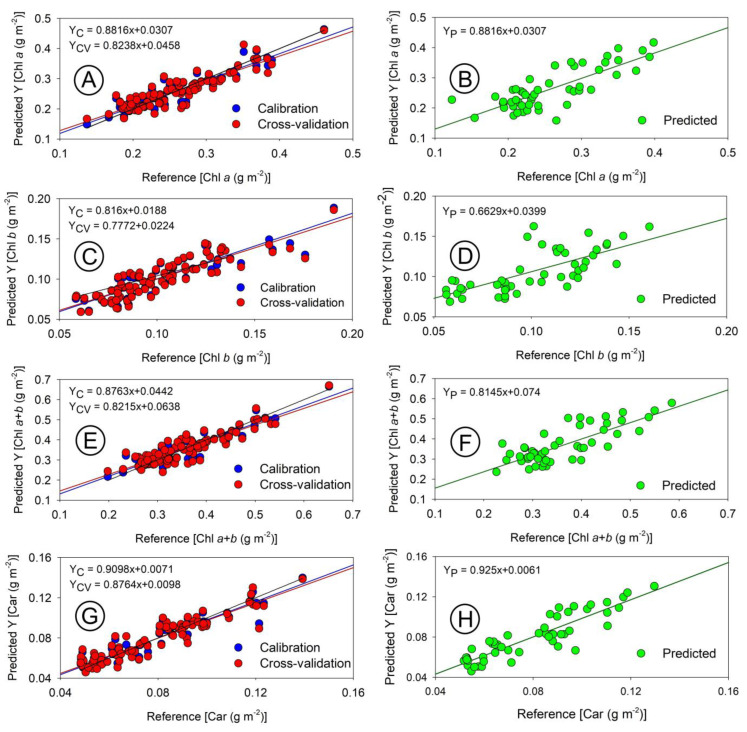
Figure 12.
Scatterplot of models based on absorbance curves (400–700 nm) obtained with the spectroradiometer. (A,B) chlorophyll a (Chl a). (C,D) chlorophyll b (Chl b). (E,F) chlorophyll total (Chl a+b). (G,H) carotenoids (Car). Linear equation estimates were reported for calibration (YC; blue dots), cross-validation (YCV; red dots), and predicted (YP; green dots).

