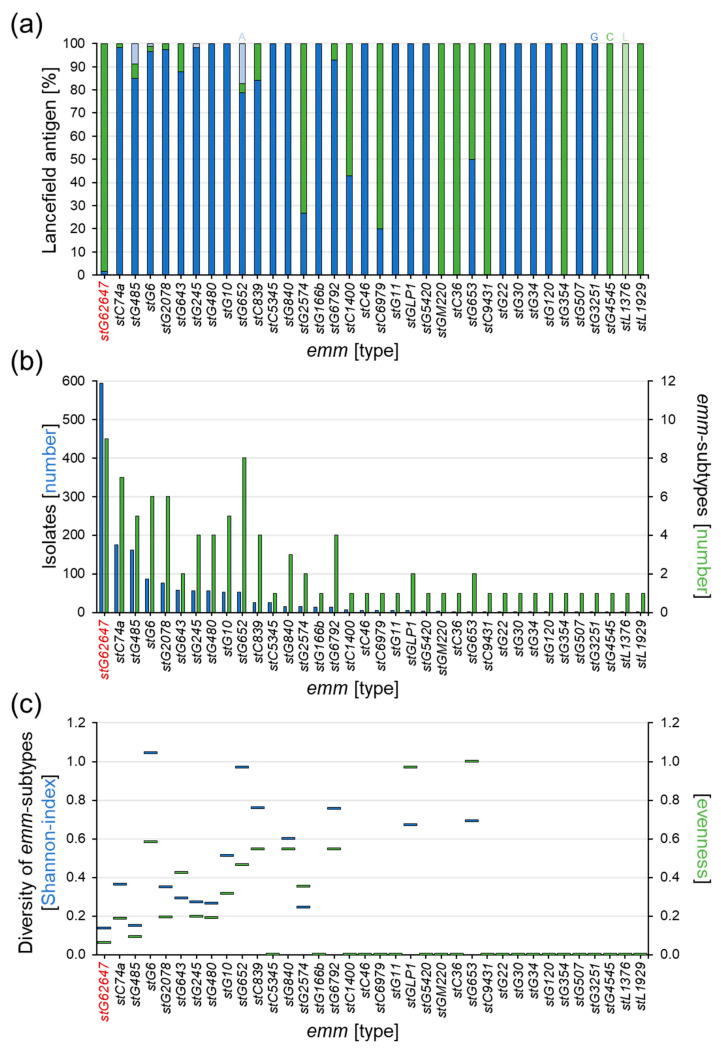
Figure 2.
Analysis of the Lancefield antigen expression and mutation rate within the different emm types of the national study cohort. (a) Ratio of Lancefield antigen expression of the 36 emm types in the national study cohort (columns), showing antigen A (light blue), antigen C (green), antigen G (blue), and antigen L (light green). (b) Number of isolates per emm type (blue columns) and number of corresponding emm subtypes (green columns) for all 36 emm types in the national study cohort. (c) Comparison of relative mutation rate within the 36 emm types by Shannon index (blue bars) and evenness (green bars).

