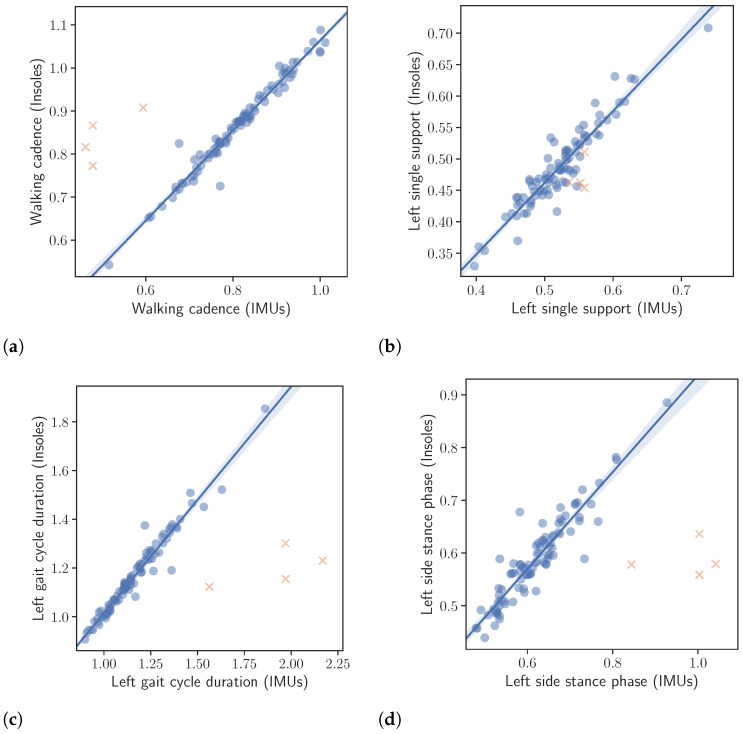
Figure 5.
Correlation between the extracted gait kinematic features from the data of the instrumented insoles and the IMU-based devices. Note that the orange crosses represent outliers. The outliers were not taken into account in the calculation of the regression line or the correlation values presented in the text. (a): Walking cadence. (b): Left single support. (c): Left gait cycle duration. (d): Left side stance phase.

