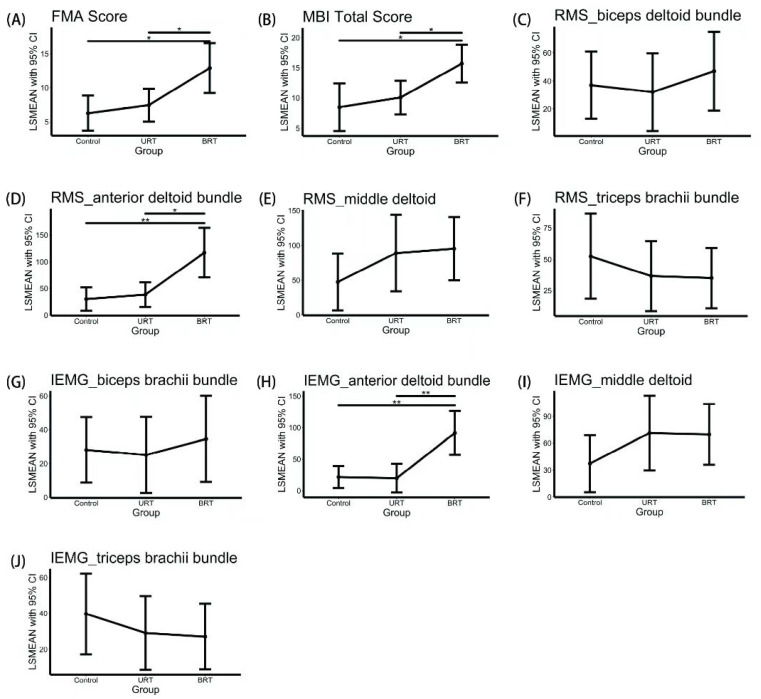
Figure 2.
Post-hoc analysis of group comparisons of outcome variables using t-test adjusted with the Bonferroni method, p-values of post hoc tests were shown in Supplementary Table S3; * p < 0.0167, ** p < 0.0033. Post-hoc comparisons: (A) Fugl-Meyer Assessment–Upper Extremities (FMA-UE) score; (B) Mod-ified Barthel Index (MBI) score; (C) root mean square (RMS) of biceps brachii bundle; (D) RMS of anterior deltoid bundle; (E) RMS of middle deltoid; (F) RMS of triceps brachii bundle; (G) integrated electromyographic (iEMG) of biceps brachii bundle; (H) iEMG of anterior deltoid bundle; (I) iEMG of middle deltoid; (J) iEMG of triceps brachii bundle.

