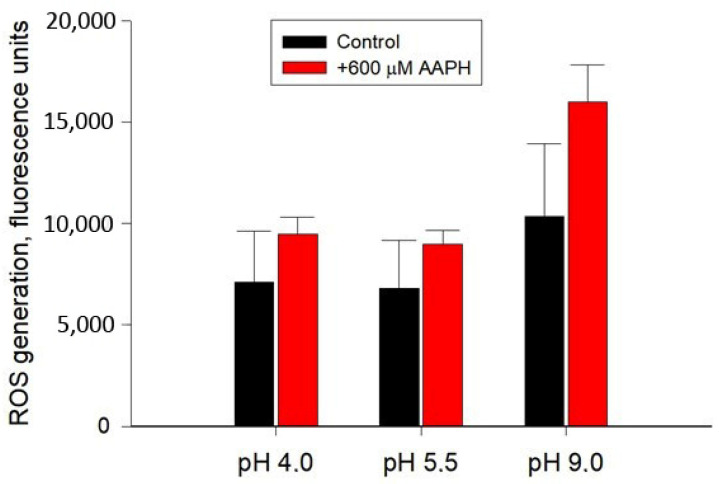
Figure 2.
Fluorescence intensity (units), reflecting total ROS generation, 60 min after cell suspension staining with Y. lipolytica W29 H2DCF-DA at various pH values. Cells exposed to pro-oxidant 600 μM 2,2′-azobis(2-methylpropionamidine) dihydrochloride (AAPH) were used as a positive control. The incubation medium for the experiments contained 50 mM KPi, pH 5.5; and 1% glucose. Values are mean ± standard deviation from 5–6 independent experiments. No statistically significant differences compared to the corresponding control.

